October 2, 2026
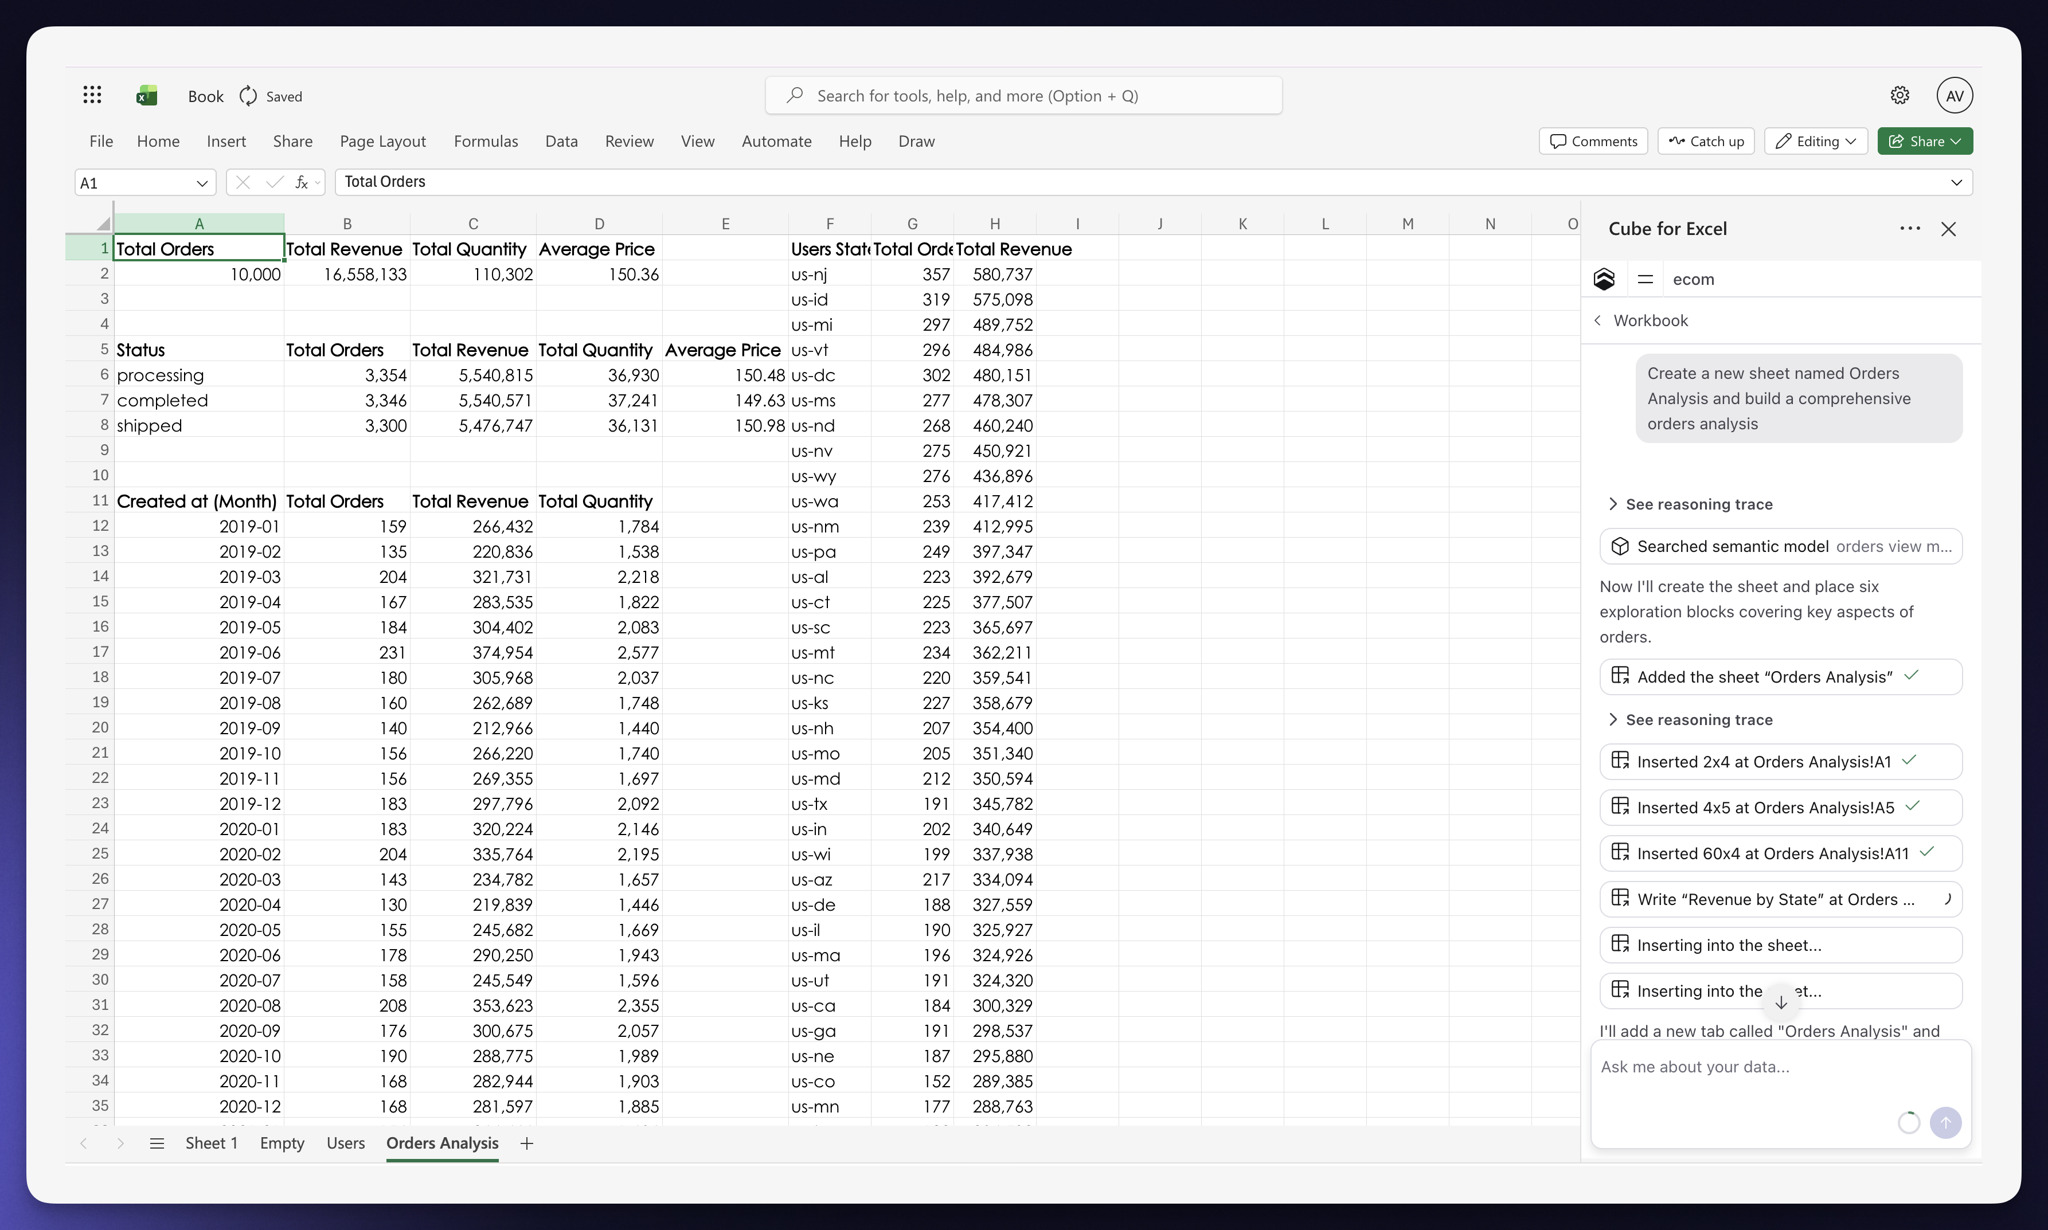
AI chat is now available in Cube for Sheets and Cube for Excel. Ask a question in plain language, and Cube can query your governed data and place the results directly into spreadsheet cells as an exploration.
Chat can refresh or clear placed explorations, manage sheets, and organize saved explorations into folders. Drag an exploration into the conversation for context, review changes before Cube overwrites cells or modifies a sheet, and return to past conversations in Chat History.
Other improvements and fixes:
Dashboards
- Dashboard filters can now choose a default from live data: the first or last dimension value, or the value with the highest or lowest measure
- Fixed suggestions in filters linked to a date filter so they match the chart’s date range and time zone
Visualization
The chart picker now groups chart types into Basics, Flow, and Other. Bar chart layouts are selected through Break down by in the Fields tab.
AI
Analytics Chat now recovers interrupted responses after a server restart or temporary connection failure. You can also select Continue on a stopped response.
Modeling
- Added a dbt pull option to make generated cubes private by default while respecting visibility set on individual dbt models
- Added
memo() for JavaScript models and @memo for Python template helpers to reuse results during model compilation
- Supported time-shifted measures stored in pre-aggregations can now be served through views and at coarser grains
API
- Authorized catalog integrations can now request private cubes, views, members, and permitted lineage from the Metadata API using
include_private=true
- The Metadata API now includes the configured BigQuery project ID in
/v1/data-sources responses
- Fixed SQL API queries that dropped filters over literal subqueries
Workspace
You can now pin Visual Model, Query History, Pre-Aggregations, and Performance to the sidebar. Open section menus stay open across navigation and sessions.
September 25, 2026
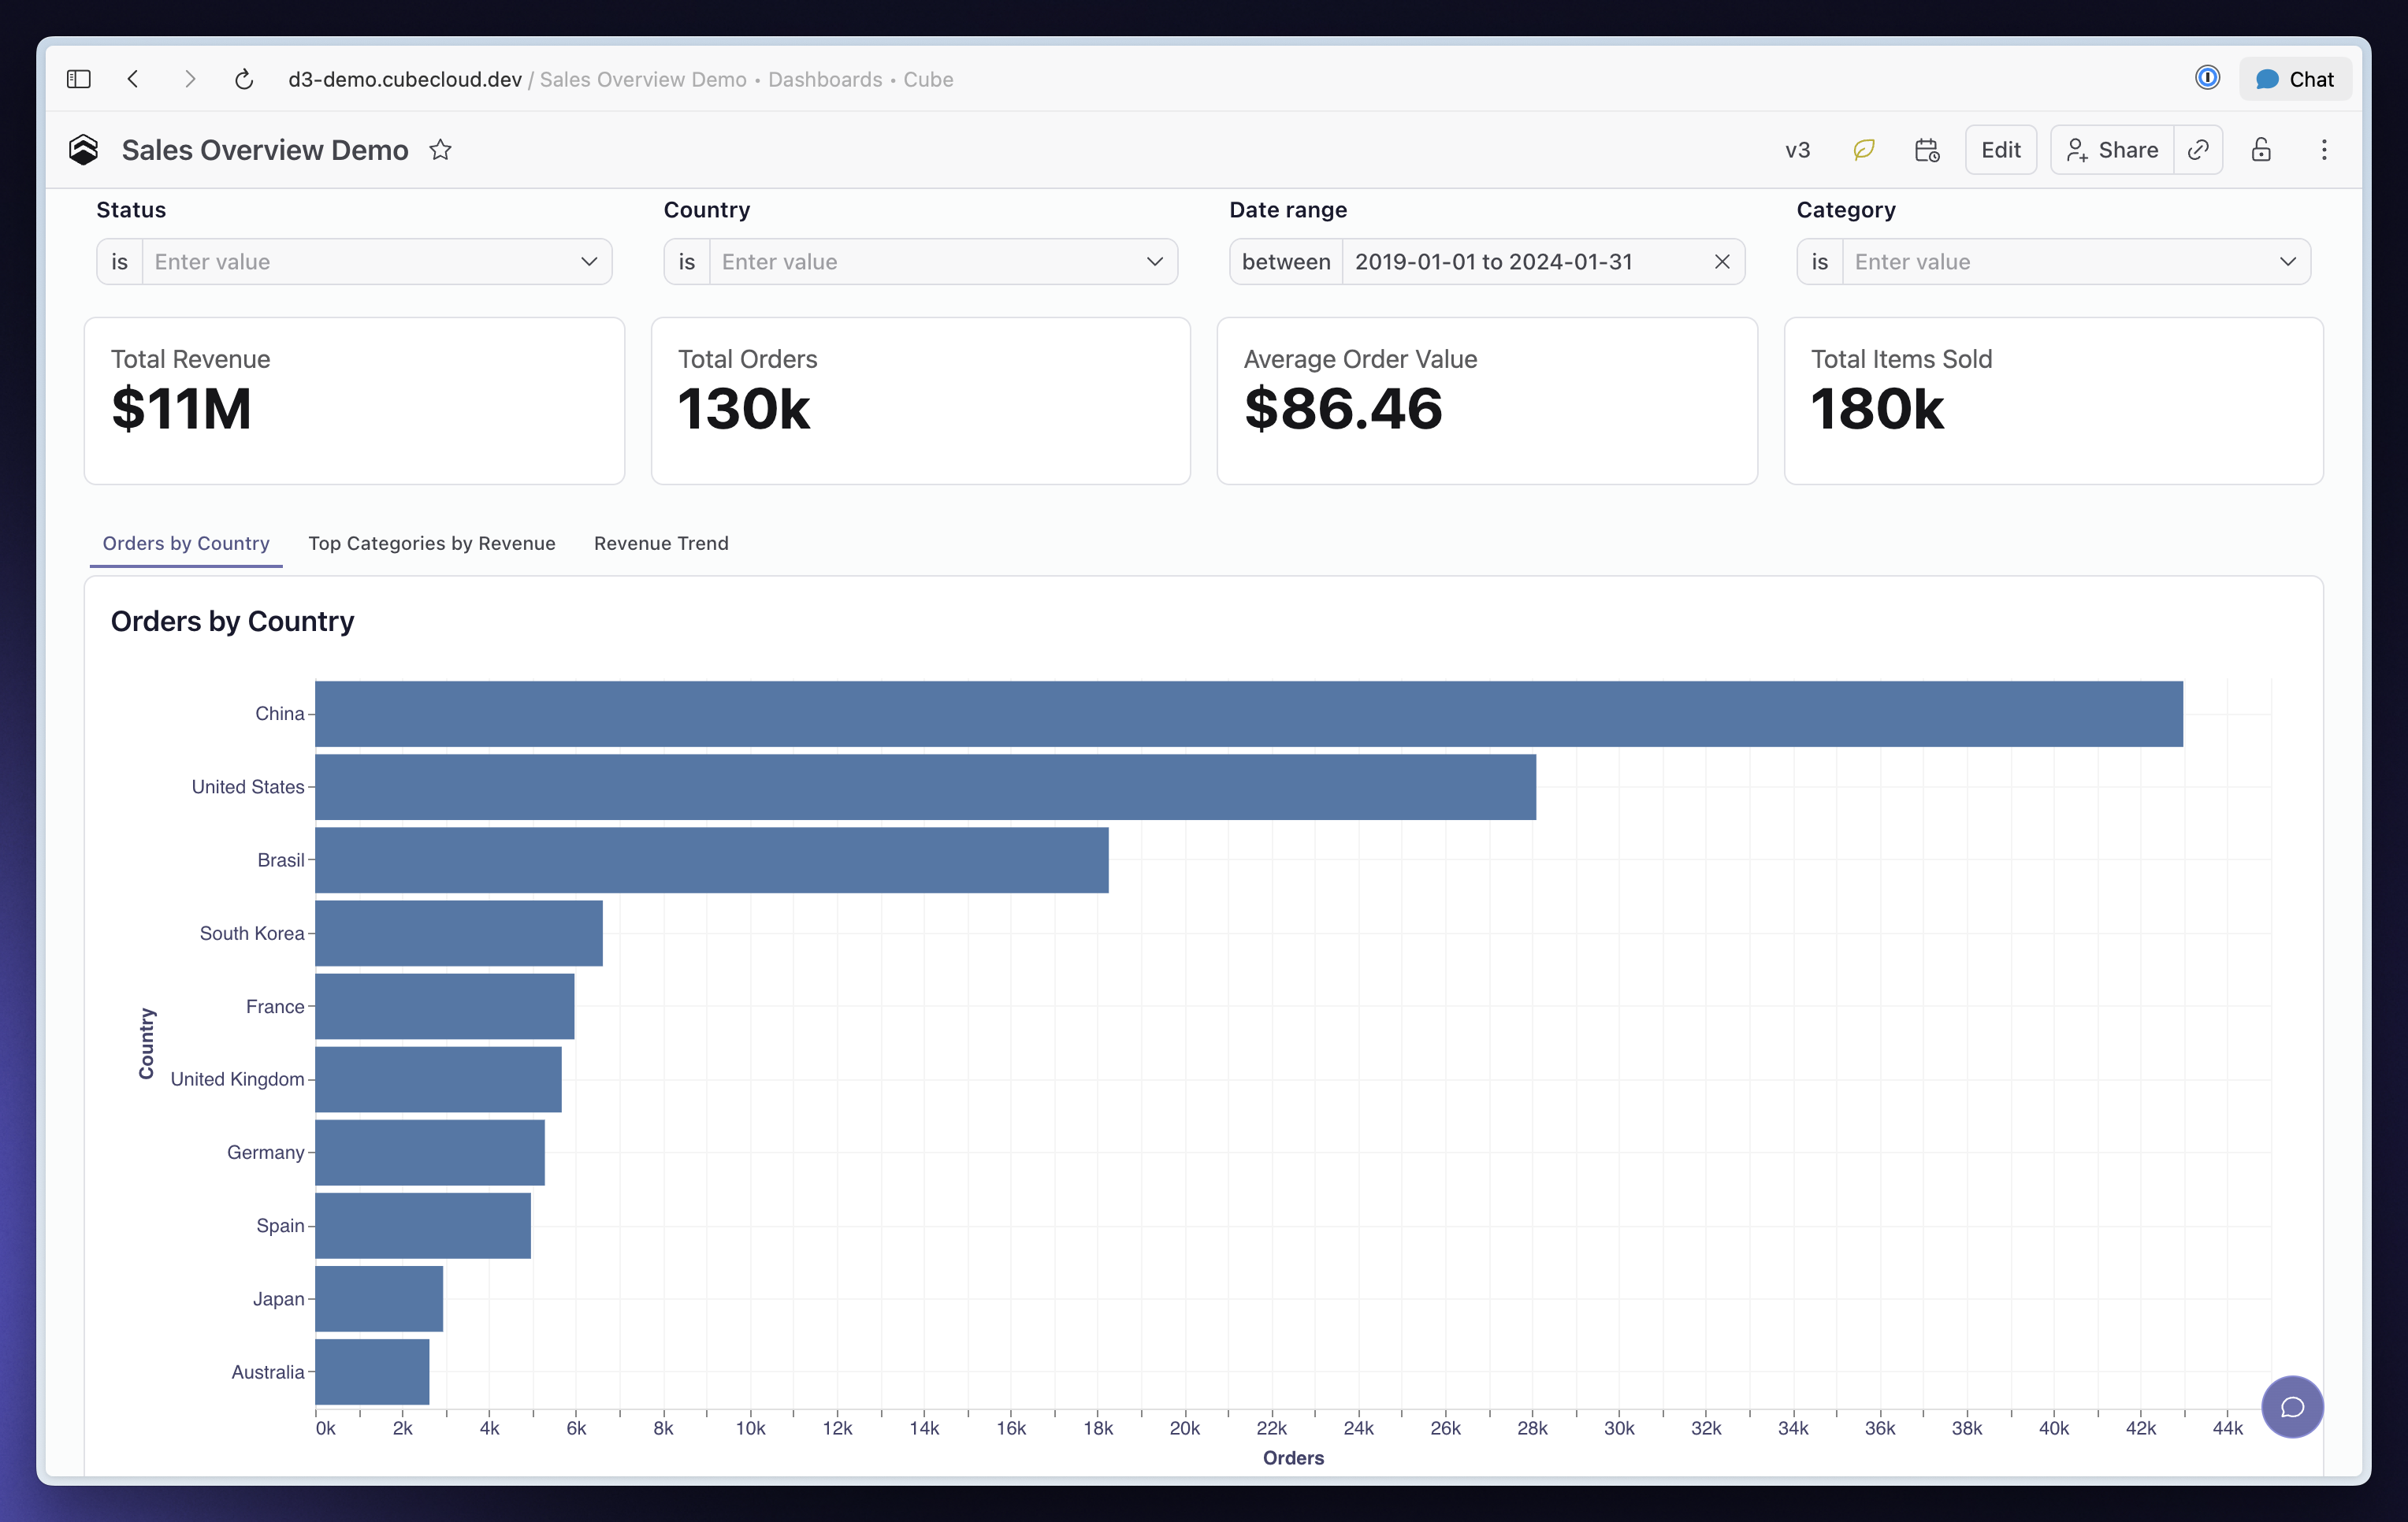
You can now organize related charts into tabs within a single Dashboard, giving viewers more ways to explore without making the page longer.
Add a Tabs container from Add Containers, then drag a chart or container into each tab. Rename and reorder tabs to guide viewers through your analysis, or place a Grid or Stack inside a tab to group several widgets together.
Tabs work on published and embedded Dashboards, and shared links reopen the selected tab. PNG and PDF downloads preserve your current tab selections, while scheduled exports include every tab as a separate titled section.
Other improvements and fixes:
Workbooks
- Improved the Bin and Group editors with a distribution preview, row counts and editable labels to help you choose meaningful boundaries and groups
- Added filtering support for bin and group fields, so you can include or exclude their named values
- Added Fill in Missing Rows support for bin and group fields, keeping categories visible even when they contain no results
- Fixed the Data Pane ignoring the field order defined in your data model
Dashboards
- Added date-range, numeric-comparison and text-condition support for narrowing filter suggestions based on other active filters
- Added support for narrowing filter suggestions across semantic views by mapping a source filter to a matching dimension
- Added consistent Reset to default actions for Filter, Time Granularity, Parent and Field Switcher controls
- Improved publishing controls with visible Undo, Redo and Revert changes actions, plus details of who last published and when
- Fixed Revert changes leaving discarded control values on screen
Visualization
- Improved the Fields and Style tabs for Bar, Line, Area and Scatter charts, with settings organized by measure and axis
- Fixed measure colors, overlapping bars on opposite axes and data-label positioning when changing chart styles
- Fixed Table chart headers ignoring their configured alignment on published Dashboards
Administration
Admins can now allow non-admin users to create personal API keys limited to their own permissions.
AI
- Added custom OpenAI-compatible and Anthropic-compatible endpoint support for Bring Your Own Model, including custom model names, base URLs and request headers
- Analytics Chat now brings saved explorations, Workbooks, Dashboards and model changes together in an Artifacts tab with clickable previews
- Added development-branch and Git workflow support for MCP, so AI clients can test, commit and publish data-model changes
- Added Cube CLI support for running agent evaluations, retrieving results and checking that every question passes in CI
- Fixed conversations disappearing from chat history when moving between the Data Model page and a Workbook
Embed
- Added whole-Dashboard PNG and PDF downloads to embedded Dashboards and Creator Mode when exports are enabled
- Added per-session visibility settings for Creator Mode sharing, Dashboard settings, member names and Data Pane grouping
- Added per-session language and time-zone settings for embedded experiences
- Fixed
useCubeQuery allowing older responses to replace results after the query changes
Integrations
- Added row totals support for pivoted explorations in Google Sheets and Excel
- Improved Refresh and Refresh all in Google Sheets and Excel to report unchanged results without clearing and rewriting their cells
- Fixed pivot column totals in Google Sheets and Excel to use each measure’s aggregation, including averages and distinct counts, and preserve totals after refresh
- Fixed pre-aggregation builds using Snowflake
TIMESTAMP_TZ and TIMESTAMP_LTZ columns
Modeling
- Added uploaded
manifest.json support for dbt pulls, so your pipeline can supply the artifact it already validated without granting Cube access to the dbt repository
- Added generated-file output for dbt pulls, letting your pipeline review and commit the resulting cube definitions in your own repository
- Improved compilation times for large data models, including deployments that compile models separately for each tenant
- Fixed dbt pulls ignoring
meta.cube.public, so visibility settings declared on models and columns survive regeneration
- Fixed calendar-based period comparisons returning the current period’s values when using an incompatible pre-aggregation
- Fixed failed pre-aggregation builds appearing successful and replacing valid data with empty results
API
- Added public REST API support for managing Scheduled Tasks, triggering runs and retrieving run history
- Added public REST API support for starting evaluations, checking their status and retrieving per-question results
- Fixed incorrect totals and missing rows in Cube Store queries combining nested aggregations with
ORDER BY and LIMIT
- Fixed SQL API queries with relative-date filters failing on BigQuery
Workspace
- You can now copy Workbooks between deployments with compatible data models and update linked copies while preserving their URLs and access settings
September 18, 2026
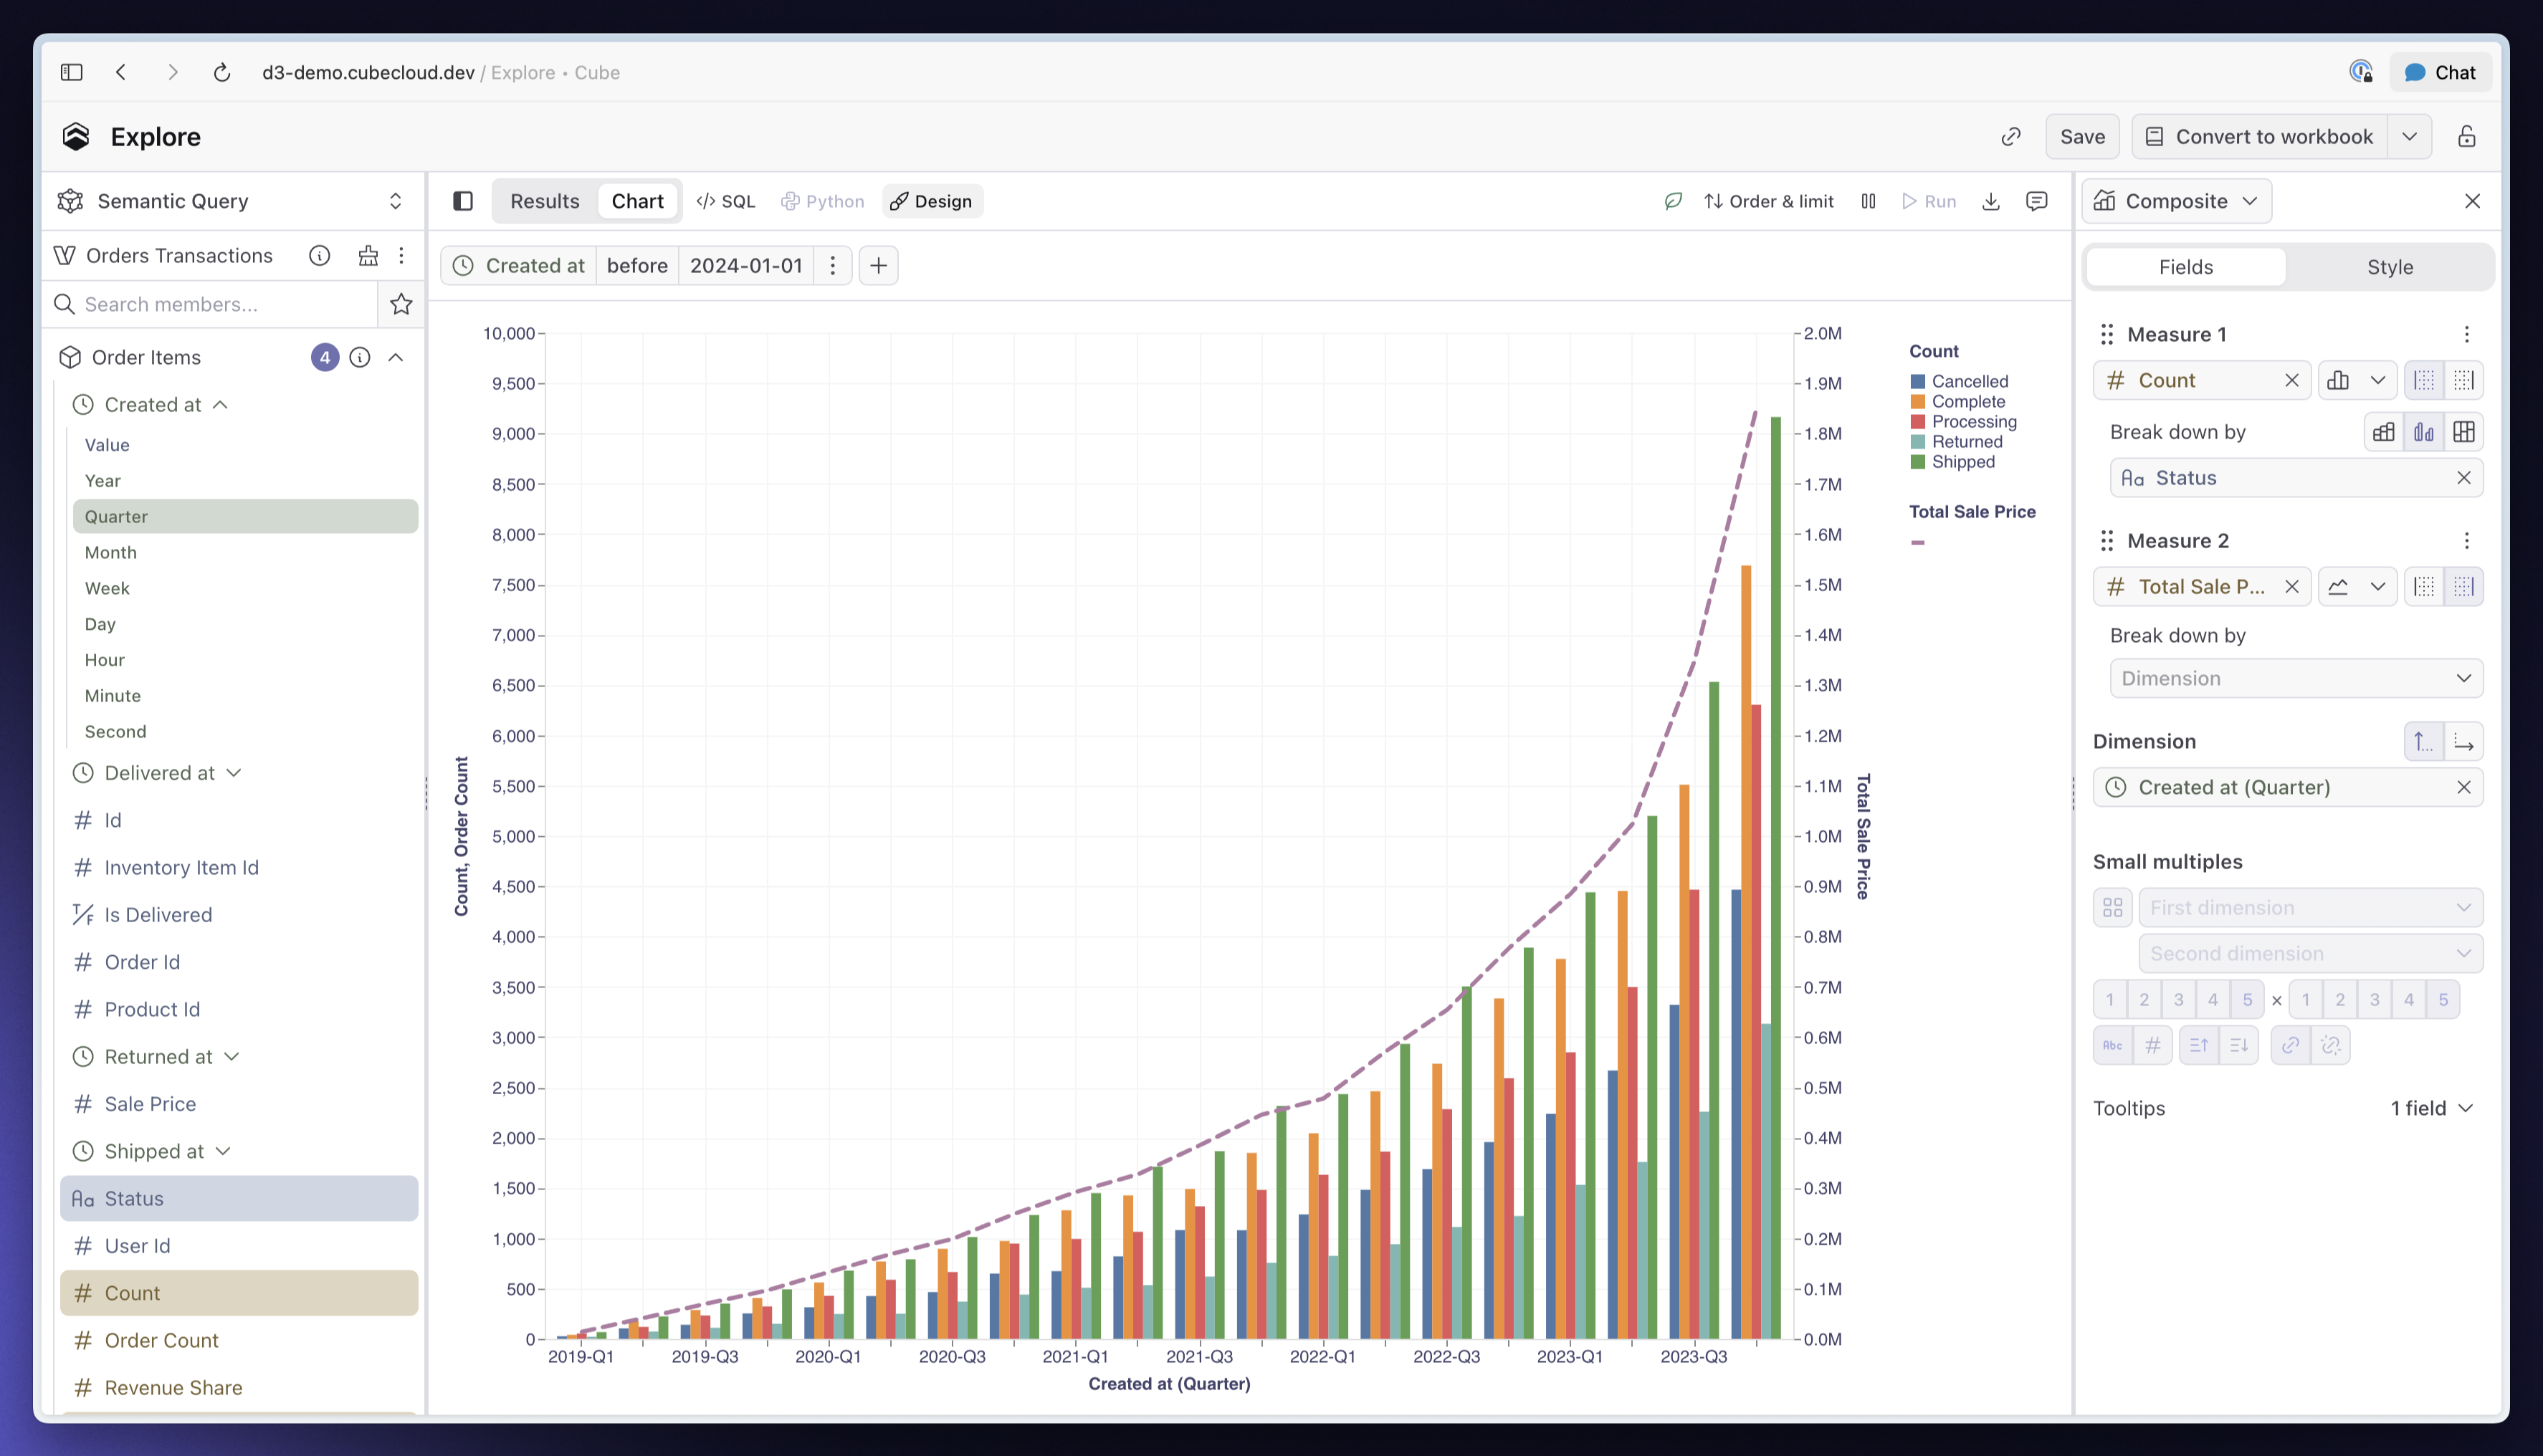
You can now combine several measures in one chart, each with its own chart type, axis, and breakdown. Plot revenue as bars and order count as a line, use separate axes when their scales differ, or synchronize both axes to compare measures on the same scale.
The redesigned Fields and Style tabs make multi-measure charts easier to build and adjust. Drag measures to reorder them, customize colors, line styles, and point shapes independently, and configure each axis alongside the measures it displays. Watch Composite charts in Cube to see it in action.
Other improvements and fixes:
Dashboards
- Improved publishing controls with visible Undo and Redo buttons, clearer publishing status, and direct access to View and Revert changes
- Published Dashboards now show their version, publication time, and a summary of changes since the previous published version
- Added Reset to default support across Dashboard controls, with Clear actions for Filter, Time Granularity, and Parent controls
AI
Added custom OpenAI-compatible and Anthropic-compatible endpoint support for bring-your-own models, including custom request headers.
Embed
Added whole-Dashboard PNG and PDF export support to embedded Dashboards and Creator Mode when exports are enabled.
Integrations
- Added pivot row totals support for Google Sheets and Excel, with totals calculated using each measure’s aggregation and preserved when saved explorations are refreshed
- Fixed Snowflake pre-aggregation builds failing on
TIMESTAMP_TZ and TIMESTAMP_LTZ columns
Modeling
- Added uploaded dbt manifest support for semantic model sync, plus
cube dbt generate to write generated models into your project for review and commit through your own workflow, without granting Cube access to your dbt repository
- Fixed incorrect totals and missing rows in pre-aggregation queries combining nested aggregations, sorting, and limits
API
- Fixed SQL queries failing against views spanning multiple data sources when the selected fields all belong to one data source
- Fixed older
useCubeQuery responses overwriting results after the query changes
September 11, 2026

Analytics Chat now keeps model branches, Workbooks, Dashboards and saved explorations connected to the conversation. Return to a chat to pick up both the discussion and the artifacts you created or linked along the way.
You can now isolate data model changes to individual chats and work on multiple changes in parallel. Switch between chats without mixing your changes or losing the context behind each task. The Artifacts tab lets you preview saved work and inspect file changes directly from the conversation.
This is another step toward the agentic analytics loops we described earlier: conversations that carry their context and artifacts as multiple analytics tasks move forward in parallel.
Other improvements and fixes:
Workbooks
- Added filtering support for bins and value groups in Workbooks
- Added Fill in Missing Rows support for empty bins and value groups
AI
- MCP clients can now query development branches and test their model, skills and rules before publishing
- Added branch management support for MCP clients, including committing, publishing and discarding model changes
Embed
- Added PNG and PDF download support for entire Dashboards in embeds with exports enabled
- You can now disable AI for individual embed customers while keeping manual authoring available
- Added language and time zone settings for individual embed sessions
Integrations
Fixed incorrect pivot totals and totals disappearing after refresh in the Google Sheets and Excel add-ons.
Modeling
- Added support for importing models from an uploaded dbt manifest, so Cube can use your CI output without access to the dbt repository
- Fixed rolling-window queries on Snowflake failing without a date range when using standard time granularities
API
- Added Dashboard PNG and PDF export support to the public REST API for your own reporting workflows
- Fixed SQL pushdown for views spanning multiple data sources when a query uses members from just one source
September 4, 2026
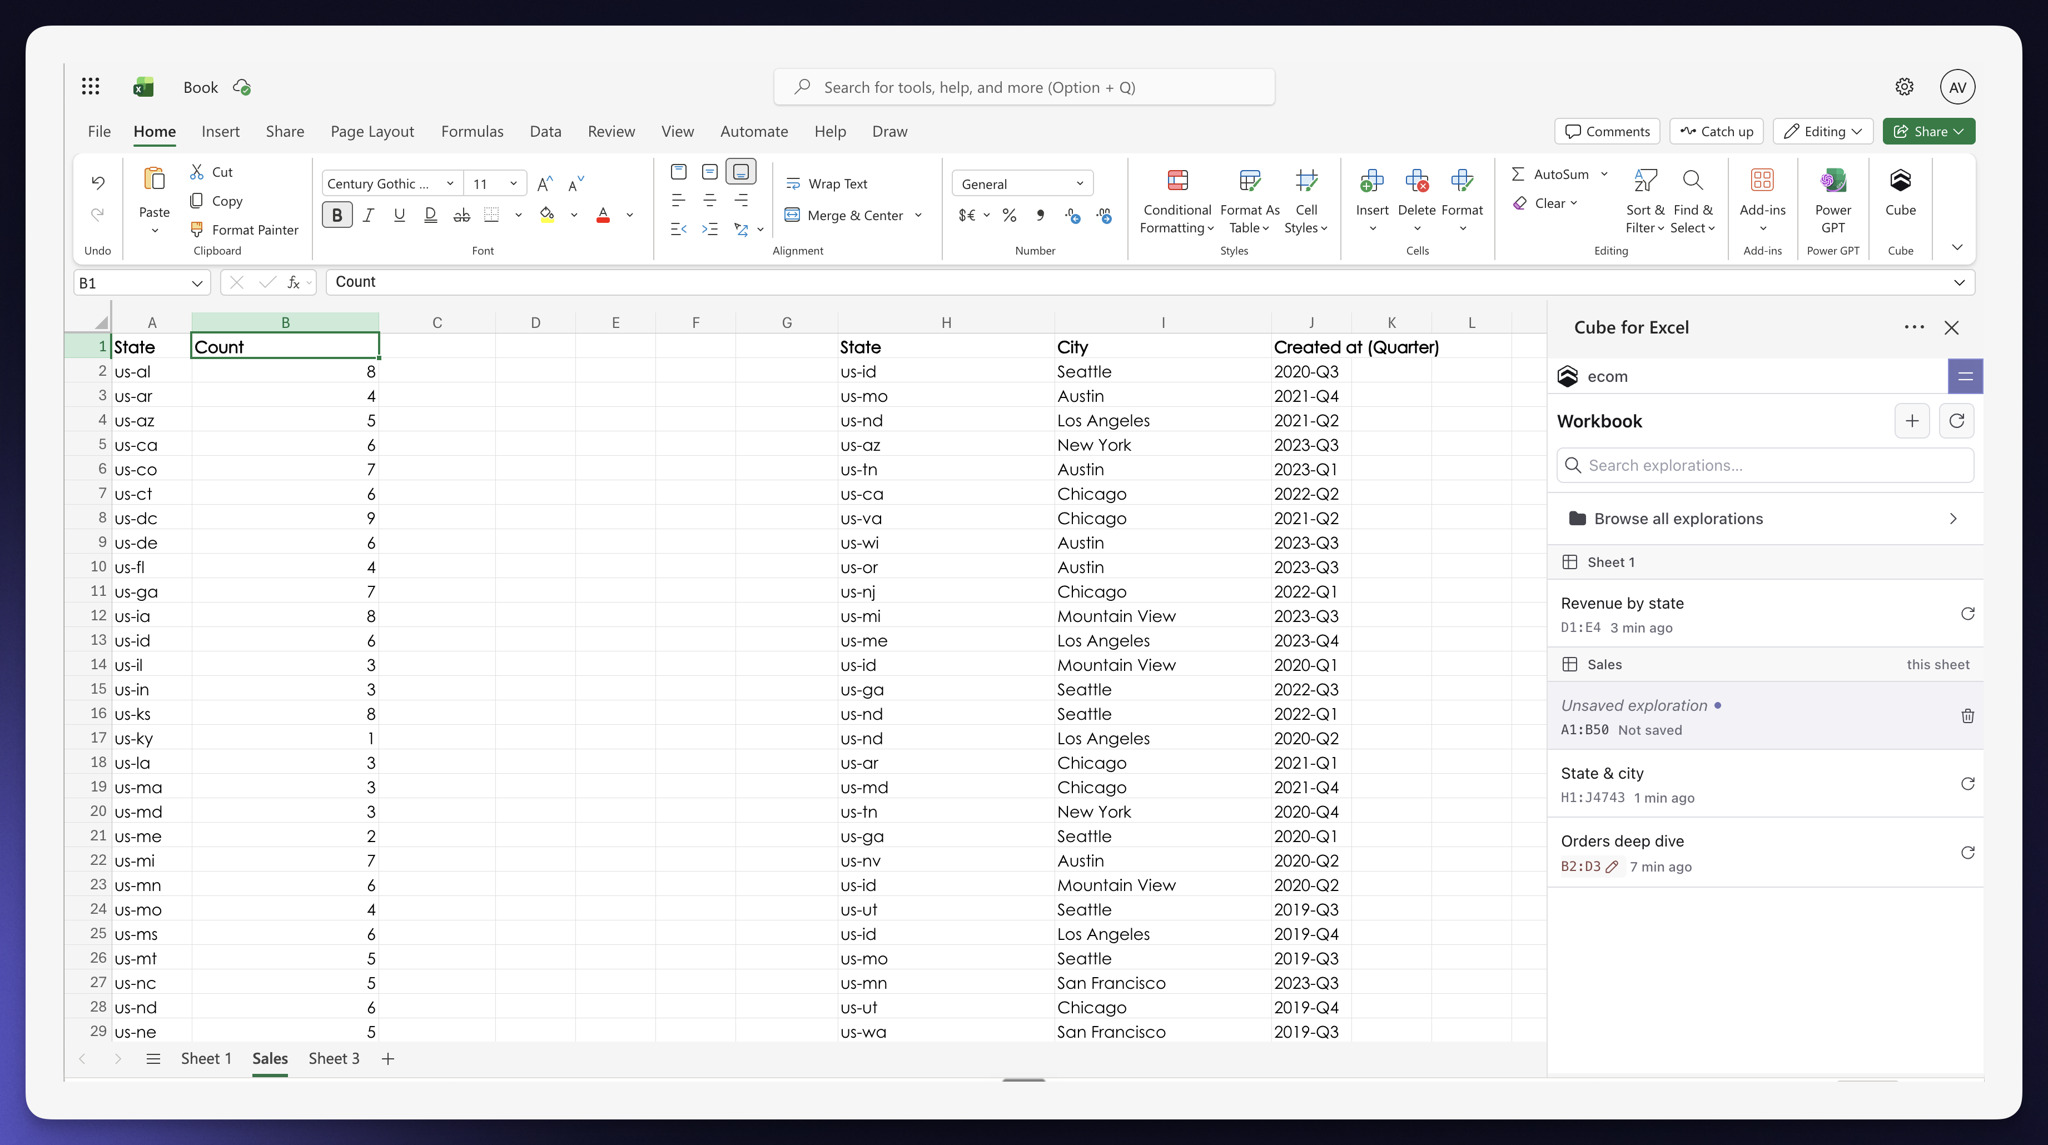
The Google Sheets and Excel add-ons now open on a workbook home that groups every placed exploration by sheet and shows its range, freshness and status. The pane follows the current cell, calls out missing or hand-edited results and makes it clear where a new exploration will be written.
You can switch between multiple explorations without losing drafts, drag dimensions and measures directly into pivot and filter zones and follow tracked progress for Run or Refresh all. New settings also let you control sheet following, automatic runs and result placement, or detach and delete explorations from the workbook.
Field Switcher
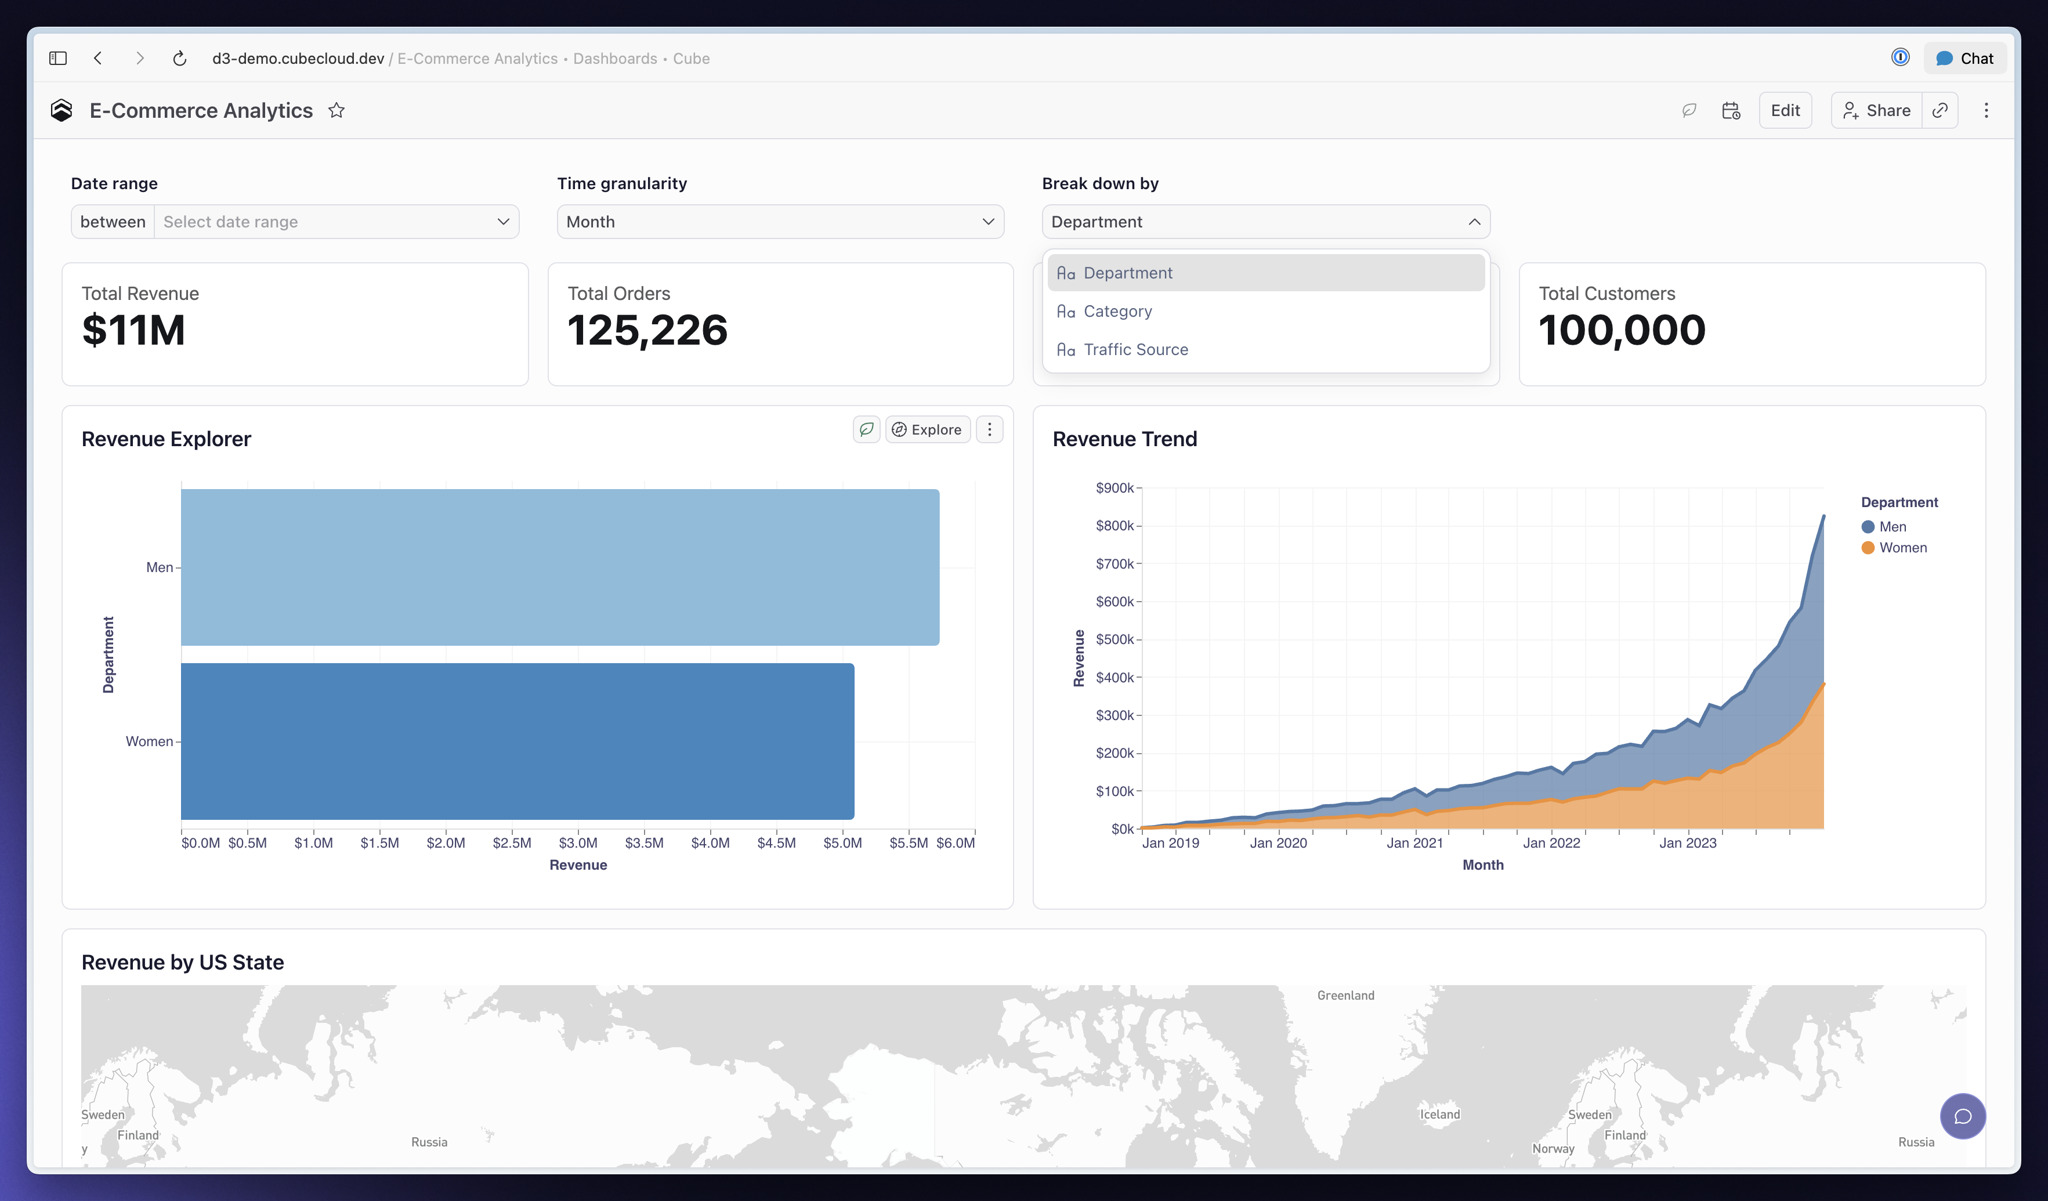
You can now let Dashboard viewers swap the dimension or measure behind a chart without adding duplicate charts. Add a Field Switcher from Add Controls, choose the field it replaces and offer alternatives such as Status or City, Order count or Total revenue.
The chart keeps its formatting, sorting, pivots and conditional formatting as the field changes. Defaults can be static or personalized with a user attribute, Parent controls can drive the selection and the selected field carries into shared links, exports and scheduled delivery.
Other improvements and fixes:
Workbooks
- Equal-interval bins now start with a range and bucket size based on the selected column's actual values
- Boolean dimensions can now use Group values to rename true and false values
- Added Table chart support for a Vertical records pivot preset, with fixes for fully pivoted layouts
- Refresh now distinguishes queued pre-aggregation rebuilds from completed refreshes and keeps progress visible until the new rollup is ready
Dashboards
- Added user attribute defaults to Time Granularity controls
- Fixed Edit in Workbook dropping applied Dashboard filters from the editing session
- Fixed Security Context changes leaving period comparison or totals data from the previous context on screen
- Fixed reloading the Dashboard builder during AI widget generation showing the previous summary
Visualization
- Added horizontal orientation support for Funnel charts
- Sankey charts can now render cyclic flows by splitting the node that closes each loop
Administration
- The App Theme editor now builds light, dark and high-contrast modes from one adaptive palette
- Admins can now choose an account-wide default Deployment, while each user can set a personal default in Preferences
- The Deployments page now shows whether each Deployment is Active, Suspended or Always on without waking it
AI
- Analytics Chat can now create, save and preview Sankey charts
- Fixed link-formatted dimensions rendering as plain text in Analytics Chat tables
Embed
- Creator Mode embed headers now include workbook actions for renaming, duplicating, creating and deleting workbooks
- Creator Mode embed users can now share folders from the row menu
- Fixed Edit in Workbook leaving the Creator Mode embed and reporting an expired session
Modeling
- Cube CLI can now list dbt sync history and retrieve logs for individual syncs
- dbt integrations can now parse, compile or build changed models in a customer-owned validation schema before a push
- Fixed multi-stage measures combining
grain and rolling_window returning plausible but incorrect values
- Fixed custom calendar granularities crashing unrelated queries and corrected to-date rolling windows to follow the configured fiscal calendar
API
- Data API and JavaScript SDK responses now include
usedPreAggregations so you can identify which pre-aggregation served a query
- Fixed SQL API queries using window functions, multi-argument aggregates, mixed-type
CASE expressions and grouped distinct counts
Workspace
Fixed deleting a folder leaving its contents behind at the Workspace root; the confirmation now shows everything that will be deleted and stops when permissions would make the operation incomplete.
August 28, 2026
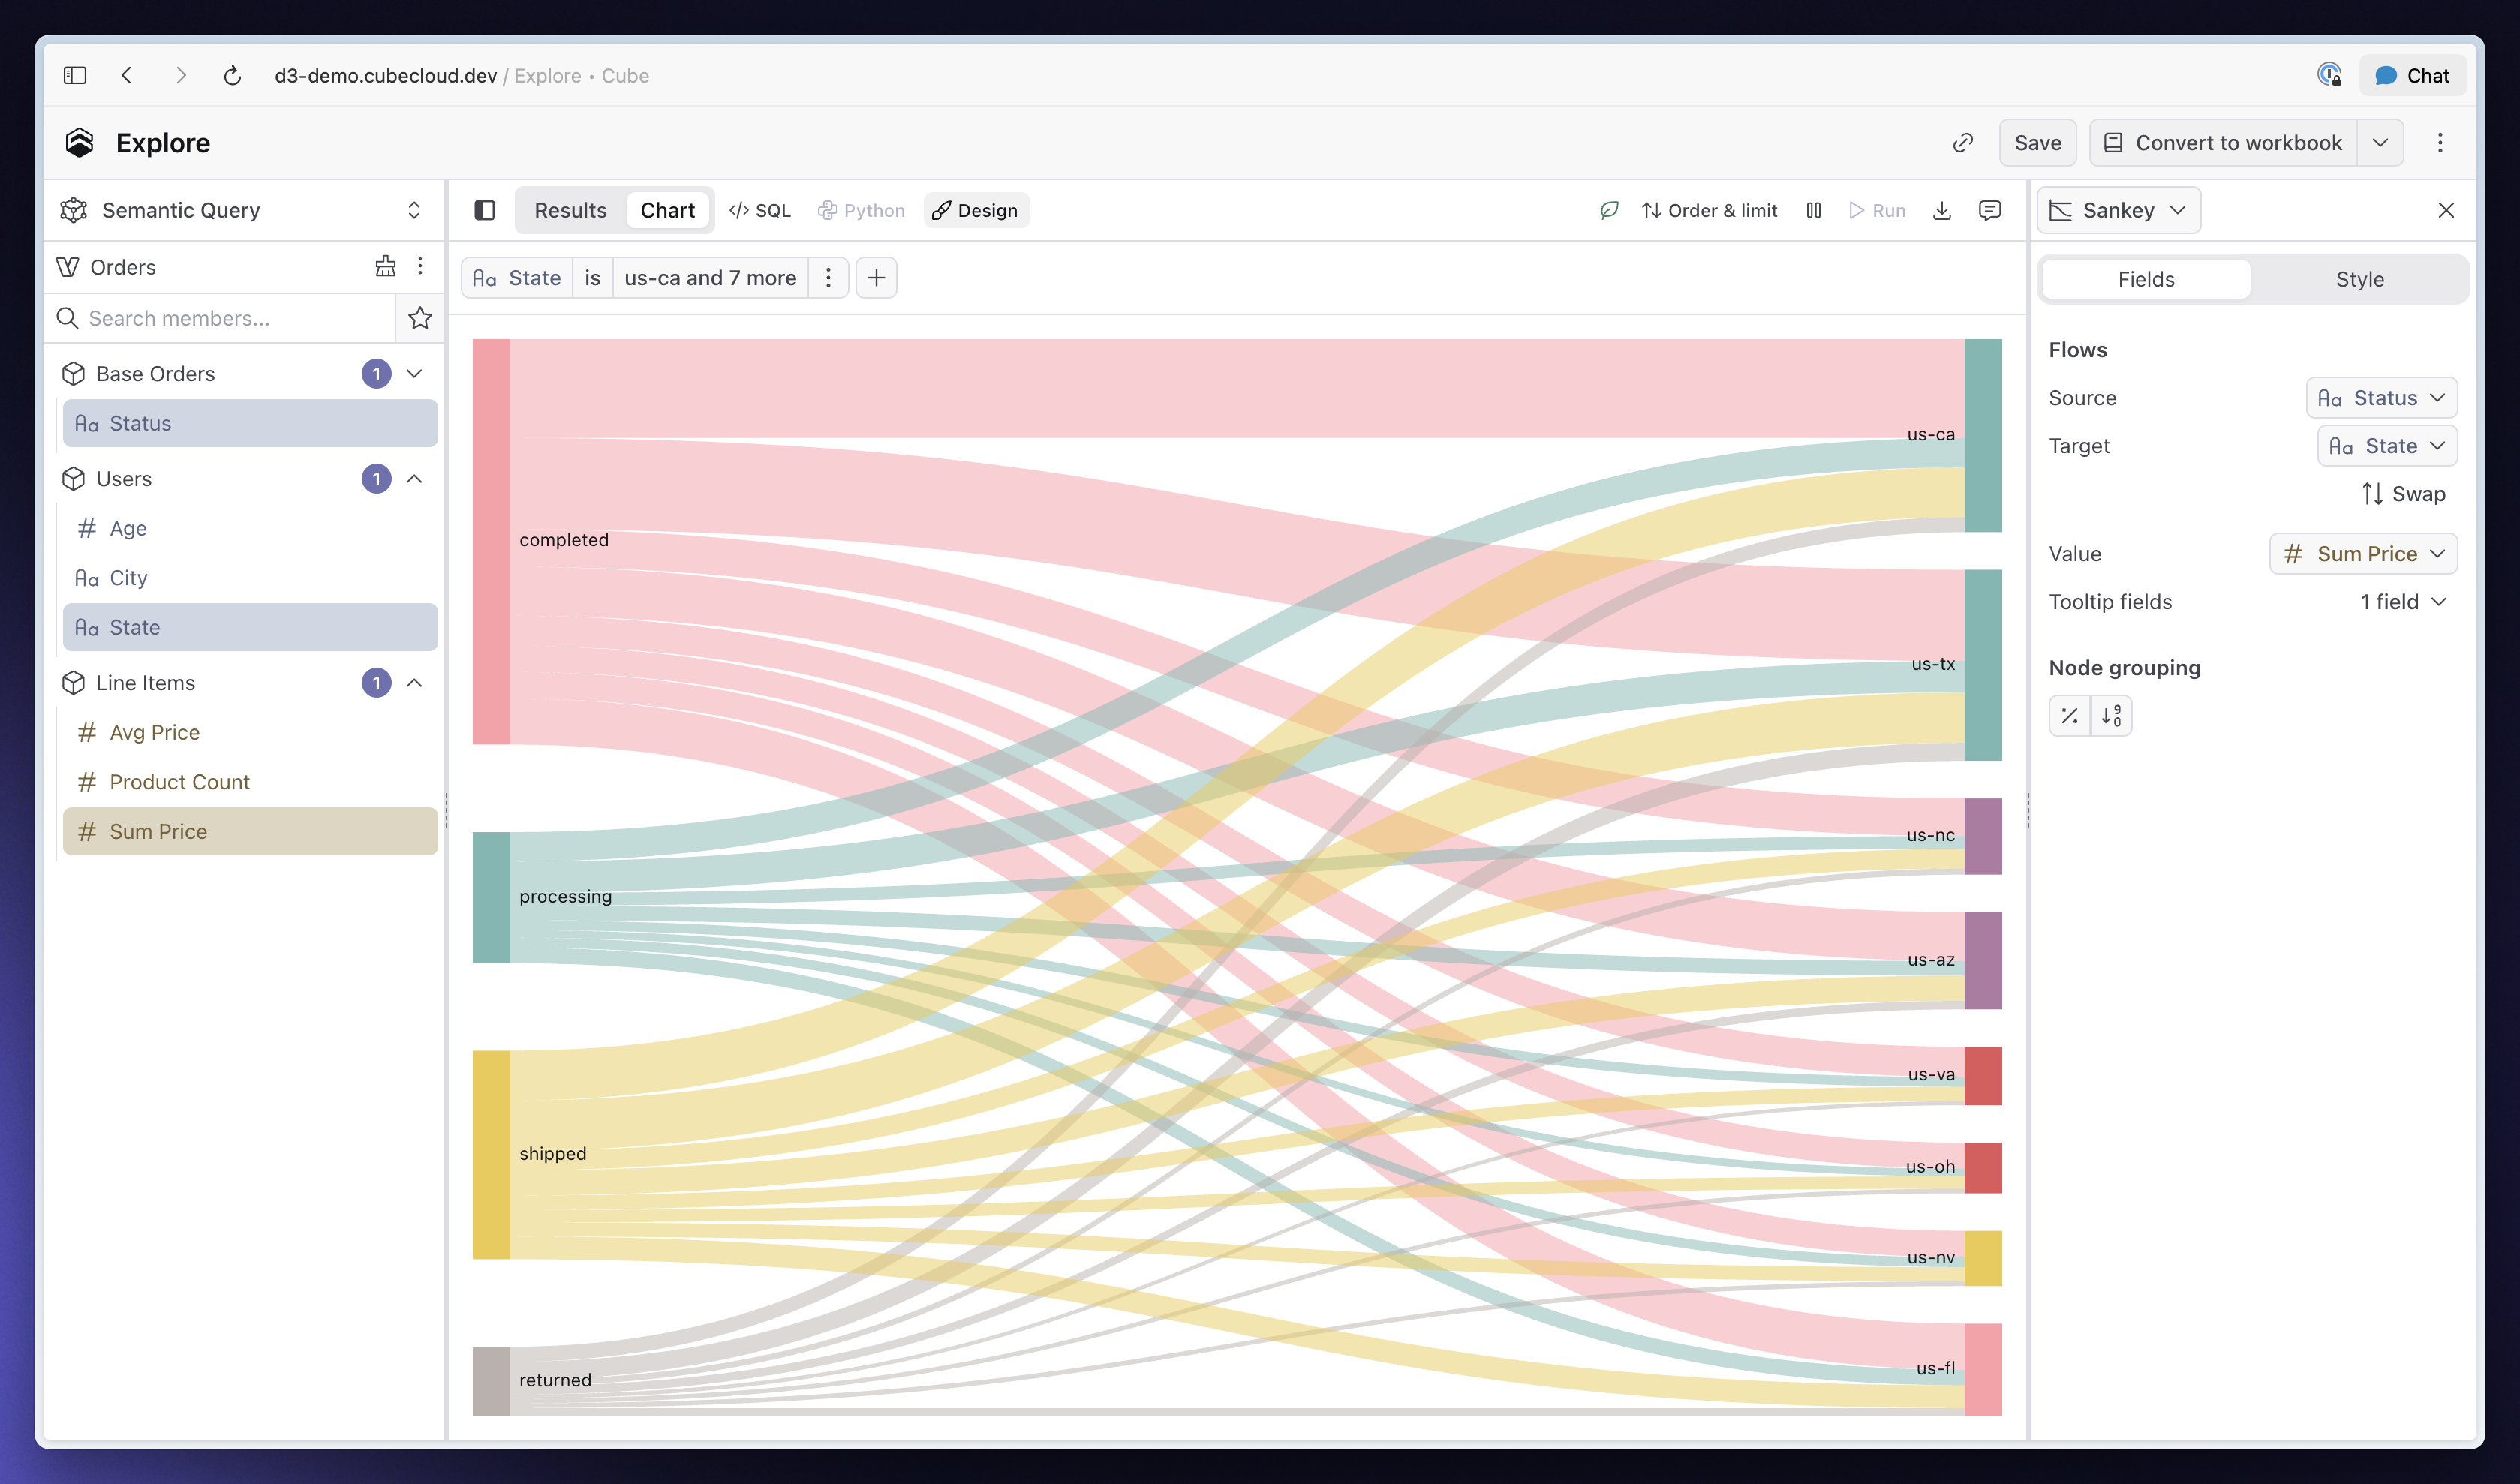
You can now turn two dimensions and a measure into a Sankey chart to show how values flow from one stage to another. Pick the source, target and value fields directly in the chart builder without writing a custom Vega specification.
Cube connects matching values into multi-stage paths, lets you group smaller nodes into Other by share or rank and supports tooltips and drill-down on individual flows. Sankey charts work in Explore, Workbooks and published Dashboards.
Parent controls
You can now add a Parent control to a Dashboard to update multiple Filter and Time Granularity controls at once. Define options such as monthly, quarterly or regional views, then map each option to the child controls it should change.
Viewers get one simple choice instead of adjusting every control separately. Parent controls work in published Dashboards, show which controls they drive and can use a user attribute to personalize the default view.
Other improvements and fixes:
Workbooks
You can now edit calculated fields directly from the Data Pane.
Dashboards
- Scheduled Dashboard notifications can now include an AI-generated “What changed” summary in email and Slack
- Users receiving scheduled refresh emails through a user group can now unsubscribe themselves, while editors get clearer controls for user and group recipients
Visualization
- Added Funnel chart support with tapered stages and optional conversion labels
- Added Table chart support for showing accurate subtotals at every row-group level, including when groups are collapsed
- Fixed Area charts showing nothing when a series contains only one data point
Administration
AI billing insights now have separate AI Usage and AI Requests pages, with searchable spend reporting, request history and clearer billing-period controls.
AI
Analytics Chat can now save a query as a standalone exploration in the Workspace, making it available to the Google Sheets and Excel add-ons.
Embed
- Embedded Creator Mode now supports creating, renaming and deleting folders
- Signed embedding sessions can now renew in place without reloading the iframe
- Embedded Creator Mode hosts can now hide individual Dashboard header controls
- Embedded Dashboards can now export charts as PNG or PDF when
allowExport=true
Integrations
- The Google Sheets and Excel add-ons can now place the same exploration on multiple sheets and keep placements intact when sheets are renamed
- Pivot reports can now put measures on rows or columns, position them before or after dimensions and reorder them
API
The public REST API now exposes dbt sync history and logs, and sync status remains available after workflow retention expires.
Workspace
When duplicating a shared Workbook or Dashboard, you can now choose whether to copy its sharing and embedding settings.
August 21, 2026
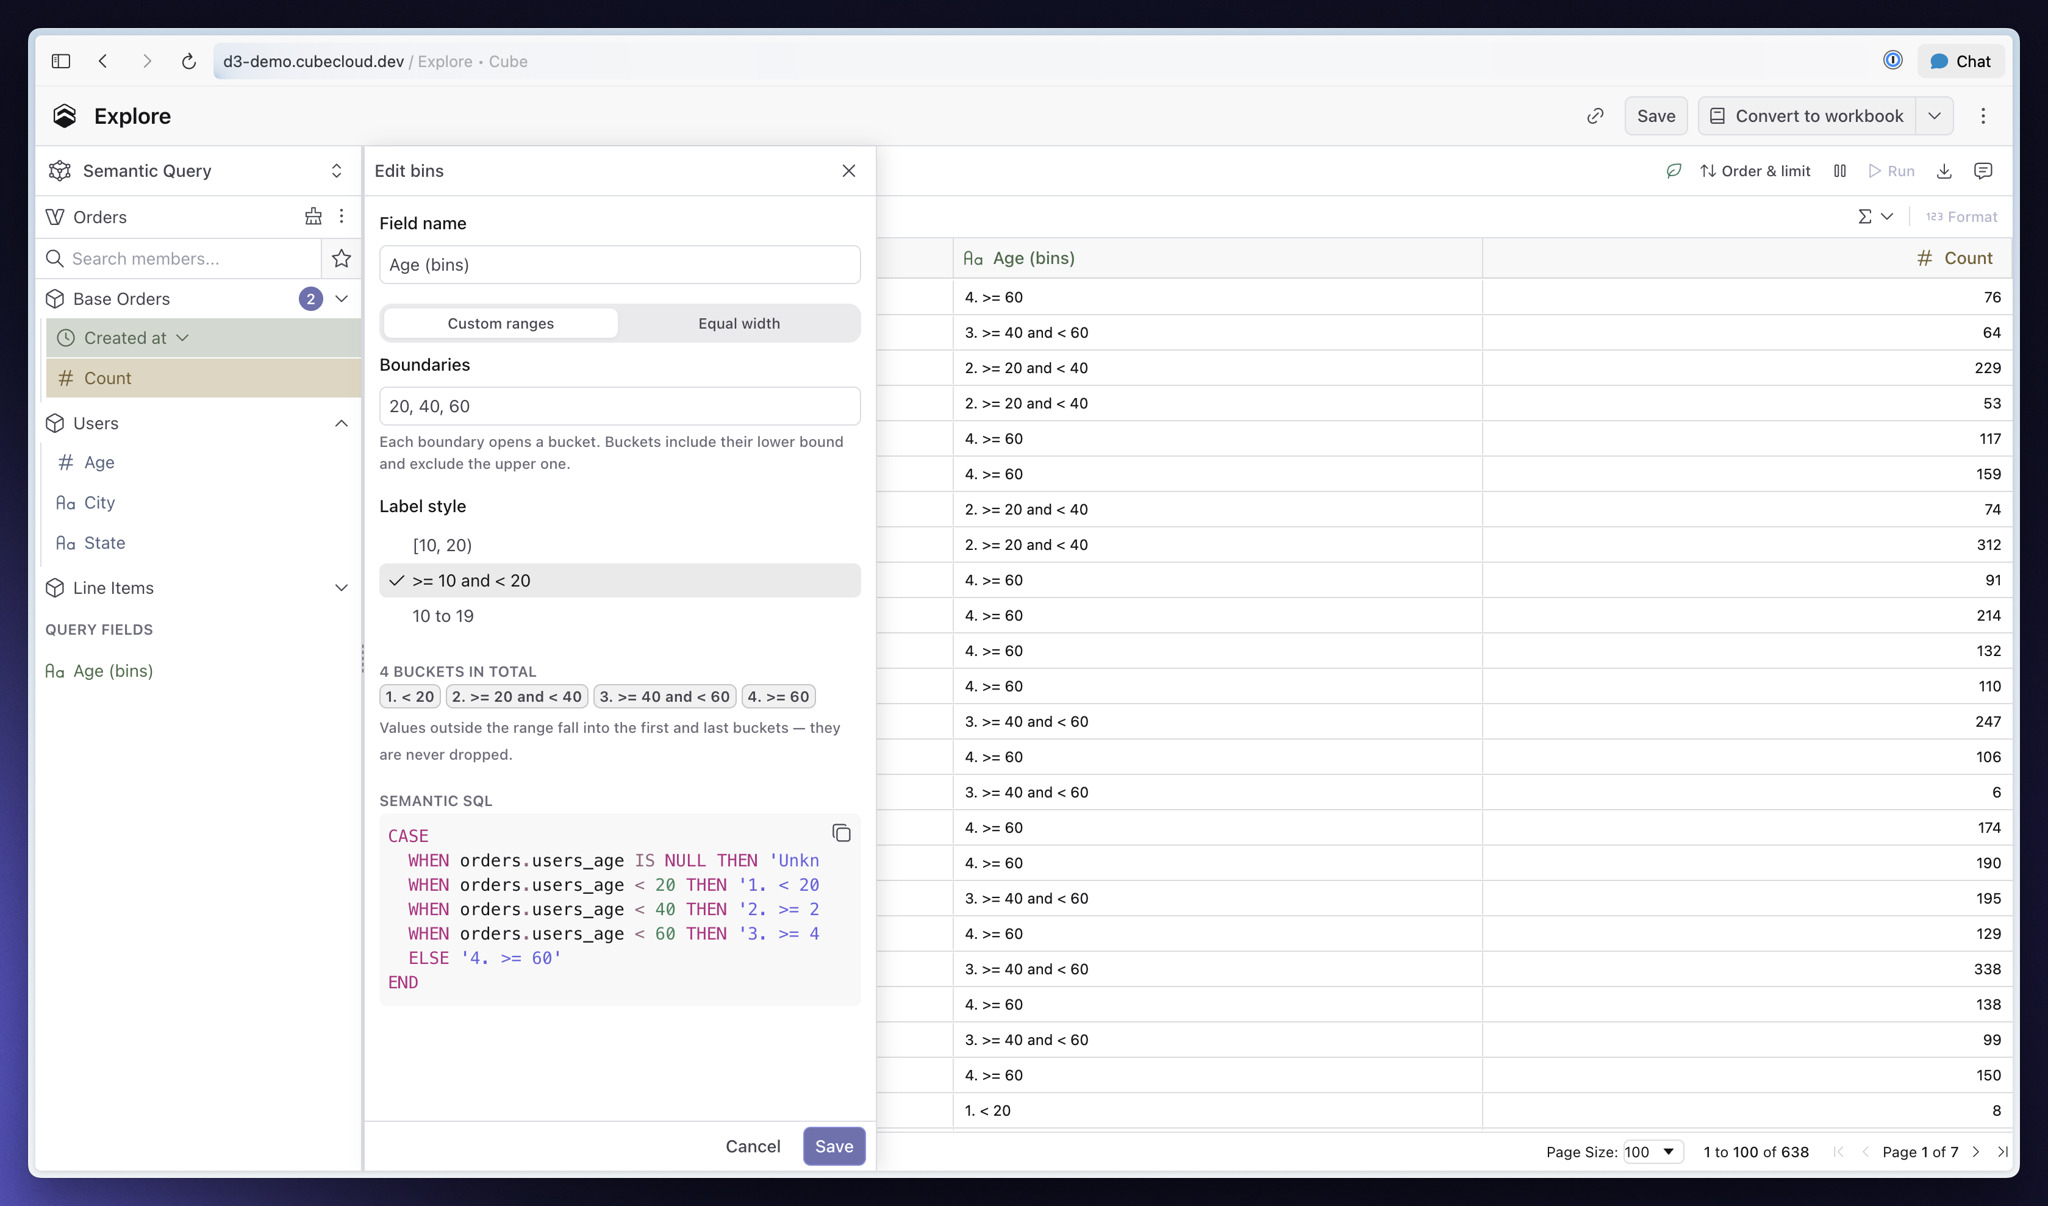
You can now turn numeric dimensions into ranges or collect string values into named groups without changing the data model. Open a dimension's menu in the Data Pane, choose Create bins or Group values, and Cube adds a query-scoped field you can use immediately.
Define numeric ranges manually or by width, choose how their labels appear, and keep values outside the range instead of dropping them. For strings, search values, name each group, and decide where everything else belongs. You can reopen the field later and edit it in place.
Other improvements and fixes:
Workbooks
Sort and row limit now share one Sort & limit popover, keeping both controls together while leaving more room in the report toolbar.
Visualization
- Table charts now support collapsible row groups, including per-level default states and expand-all or collapse-all controls
- The chart picker now recommends one best-fit visualization as your query changes and can apply a high-confidence choice to a new report
- Bar charts now use Grouped, Stacked and Stacked % entries with a separate Orientation control, so switching between vertical and horizontal preserves formatting
- Donut charts can now show the measure total in the center
Administration
- Billing now has separate Overview and Cost and Usage pages, with searchable paginated tables and clearer loading and error states
- Alerts now live in the Admin navigation alongside Billing and Audit Log
- Fixed Generated SQL in Query History showing bare
? placeholders instead of filter values
AI
- The Auto agent now uses Claude Sonnet 5, with Claude Opus 5 for data modeling on paid plans
- Analytics Chat can now run a dbt pull end to end, follow its progress, open the generated branch and summarize new cubes
- Fixed MCP connectors repeatedly asking you to reconnect when their OAuth access tokens expire
- API Credentials now includes a Chat API tab with the deployment URL, a curl example and Cube authentication guidance
Integrations
- Fixed default UI filters from a semantic view being ignored when you start an exploration in the Google Sheets and Excel add-ons
- Fixed the Google Sheets and Excel add-on side panel not scrolling when its tabs contain more controls than fit in the window
Modeling
- The model editor now recognizes the
grain parameter for multi-stage measures, including autocomplete for its fields
- Fixed Metadata API table lineage omitting source tables for cubes defined with
sql, including joins, CTEs and derived tables
API
- Personal Core Data API tokens now authenticate REST requests as well as SQL
- Cube CLI now supports
cube validate against production, a branch or the active dev-mode model, returning compiler errors and a non-zero exit code for CI
- Cube CLI now supports
cube spec to search or export the live OpenAPI specification, while deployment settings are now available through the public REST API
- Cube CLI now supports
cube data-model enable-branch and disable-branch for keeping shared-branch staging environments active from CI; the public REST API can also delete data-model branches
- Fixed Tesseract treating literal
% and _ values as wildcards in contains and notContains filters, including queries served from pre-aggregations
Workspace
- The Last viewed by you cell now shows when a Workbook or report was created and last edited, and opening it no longer changes that edit date
- Copy link is now available inside share dialogs and on Workbook and folder rows, with clear copied-state feedback
August 14, 2026
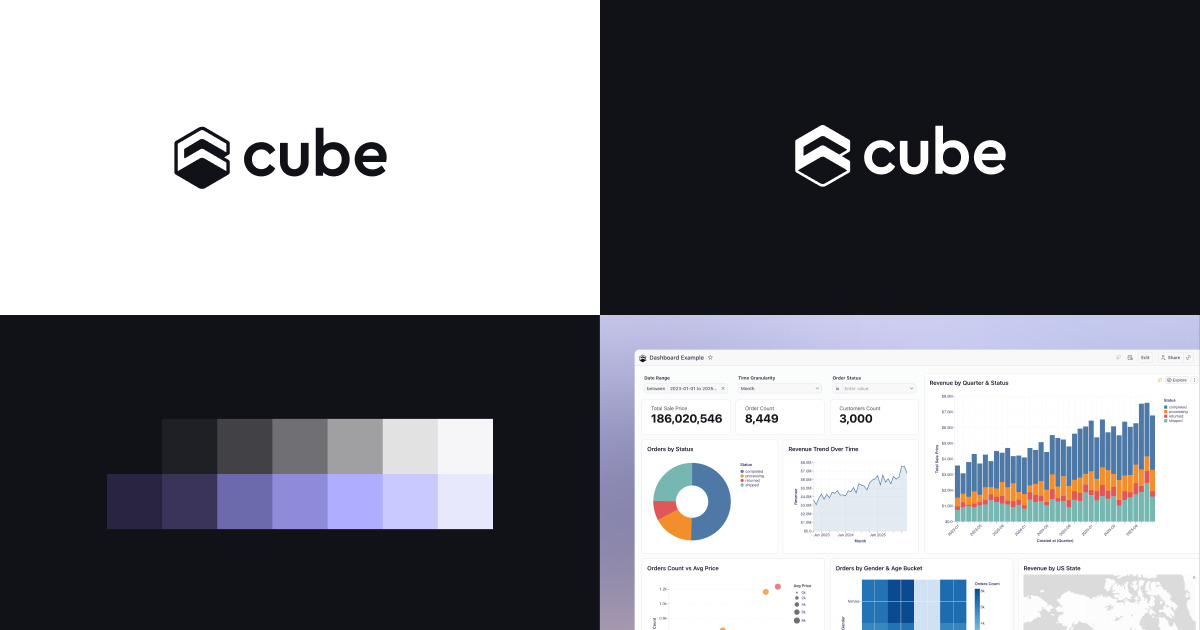
Cube has carried the same brand and the same colors since September 2018, when the first commit landed in the open source repo. It was a semantic layer for embedded analytics then. It is the agentic analytics platform now — Analytics Chat, workbooks, dashboards, embedded surfaces, with the semantic layer underneath all of it. The logo stayed put the whole time.
That changed this week. Cube has a new logo and a new look — across Cube Cloud, the sign-in pages, the Google Sheets and Excel add-ons, and the MCP app.
A dashboard reports in its own time zone
The workspace time zone policy shipped last week lets each reader bucket numbers in their own zone. A dashboard is one artifact many people read, so it can now carry a zone of its own, and everything on it agrees — charts, chat answers, drill-downs, subtotals, sparklines. Saved explorations get the same control, gated like the rest of the artifact: a read-only viewer cannot re-pin a shared exploration, and a reader cannot relabel a pinned dashboard by bringing their own zone to it. An exploration with no zone of its own inherits the workspace zone, the same as a dashboard. Both need the policy on under Admin → Settings.
Worth knowing before you turn the policy on: an exploration saved before this release, with no zone of its own, used to resolve on each reader's personal zone. It now resolves on the workspace zone, so a reader outside that zone will see different numbers on it than they did last week.
Other improvements and fixes:
Workbooks
- SQL and Python now sit in the report toolbar in both Explore and Workbooks, next to the view selector
- An exploration shared with read-only access now opens for the recipient and renders view-only, instead of redirecting them away
- You can now compare the same offset under more than one time dimension at once, so "1 month earlier by Date" and "1 month earlier by Created at" can sit in the same report
- A new report now starts on the deployment's default row limit instead of quietly running at the deployment maximum
Dashboards
- You can now download an individual chart as PNG or PDF from its menu on a published Dashboard, alongside the existing CSV
- The AI widget is now called Analysis, with Run and Refresh in place of Generate Summary and Re-run, and Refresh all charts now re-runs it too
- Adding a chart that uses a different semantic view now warns you that the dashboard's controls will not filter it, and offers to map them across
- The Layout Compaction setting has been removed from the builder — the editor now always compacts vertically
Visualization
- A Table chart column can now render image thumbnails: a dimension declared
format: imageUrl does it with no configuration, and any other string column can be switched to image mode from the Style tab
- Pie charts have a new Slice grouping control that folds small slices into a single "Other" — either everything under a share of the total, or everything past the biggest few
- Small multiples can now split by two dimensions — one across the columns, one down the rows — so each panel shows one combination of the two
- A greyed-out chart type in the picker now tells you what it needs, like "Line. Needs 1 time dimension"
- The chart type picker has a search box that answers what you want to draw: type "sparkline" and it points you at the Table and KPI settings that make one
- If you change a query so its chart type no longer fits, the chart now says what is missing and offers the nearest type that works
Administration
- The Audit Log now lists SCIM group membership changes by user email, so you can search it for who was added or dropped
- Pushing to a protected branch on Azure DevOps, GitLab or Bitbucket now tells you the branch requires a pull request, instead of reporting a repository access problem
- The billing usage bars now fill with the amount remaining, matching the caption beneath them
AI
- Every MCP tool now accepts a
deploymentId, so a connected client can reach any deployment you have access to, not just the one it connected with
- Added
readReport, updateReport and deleteReport MCP tools, so an agent can edit a report without breaking the Dashboard widgets that use it
- Fixed MCP sessions being dropped after ten minutes of quiet
- The MCP
loadQueryResults tool can now be called — every query Analytics Chat runs now comes back with the id the tool needs
Integrations
- A dbt sync can now be watched and cancelled through the deployment API, and pointed at a branch for a single run, so CI can start a sync, wait for it, and fail the job when the model breaks
- Snowflake Semantic View Sync can now pull named views instead of the whole schema, with
* patterns
- Selecting dbt models from several schemas now generates each cube against the schema that model actually builds into, instead of pointing them all at one schema
Modeling
- Time dimensions over a
DATE column now work on Trino and Presto, where they used to fail outright with a type mismatch
- A segment named in
FILTER_PARAMS now pushes its condition into the cube's SQL, so it filters the scan rather than being applied after the joins
- An ungrouped query is no longer answered from a rollup that would hand back pre-summed groups instead of raw rows
- Merging a branch through the CLI or the API now exits dev mode for anyone still working on it, instead of leaving them on a branch that no longer exists
API
The SQL API now pushes WIDTH_BUCKET down to your data warehouse.
Workspace
- An empty workspace now shows what you can do next, instead of an empty table
- The Owner column now reads "No owner" where the owner has been deleted
August 7, 2026
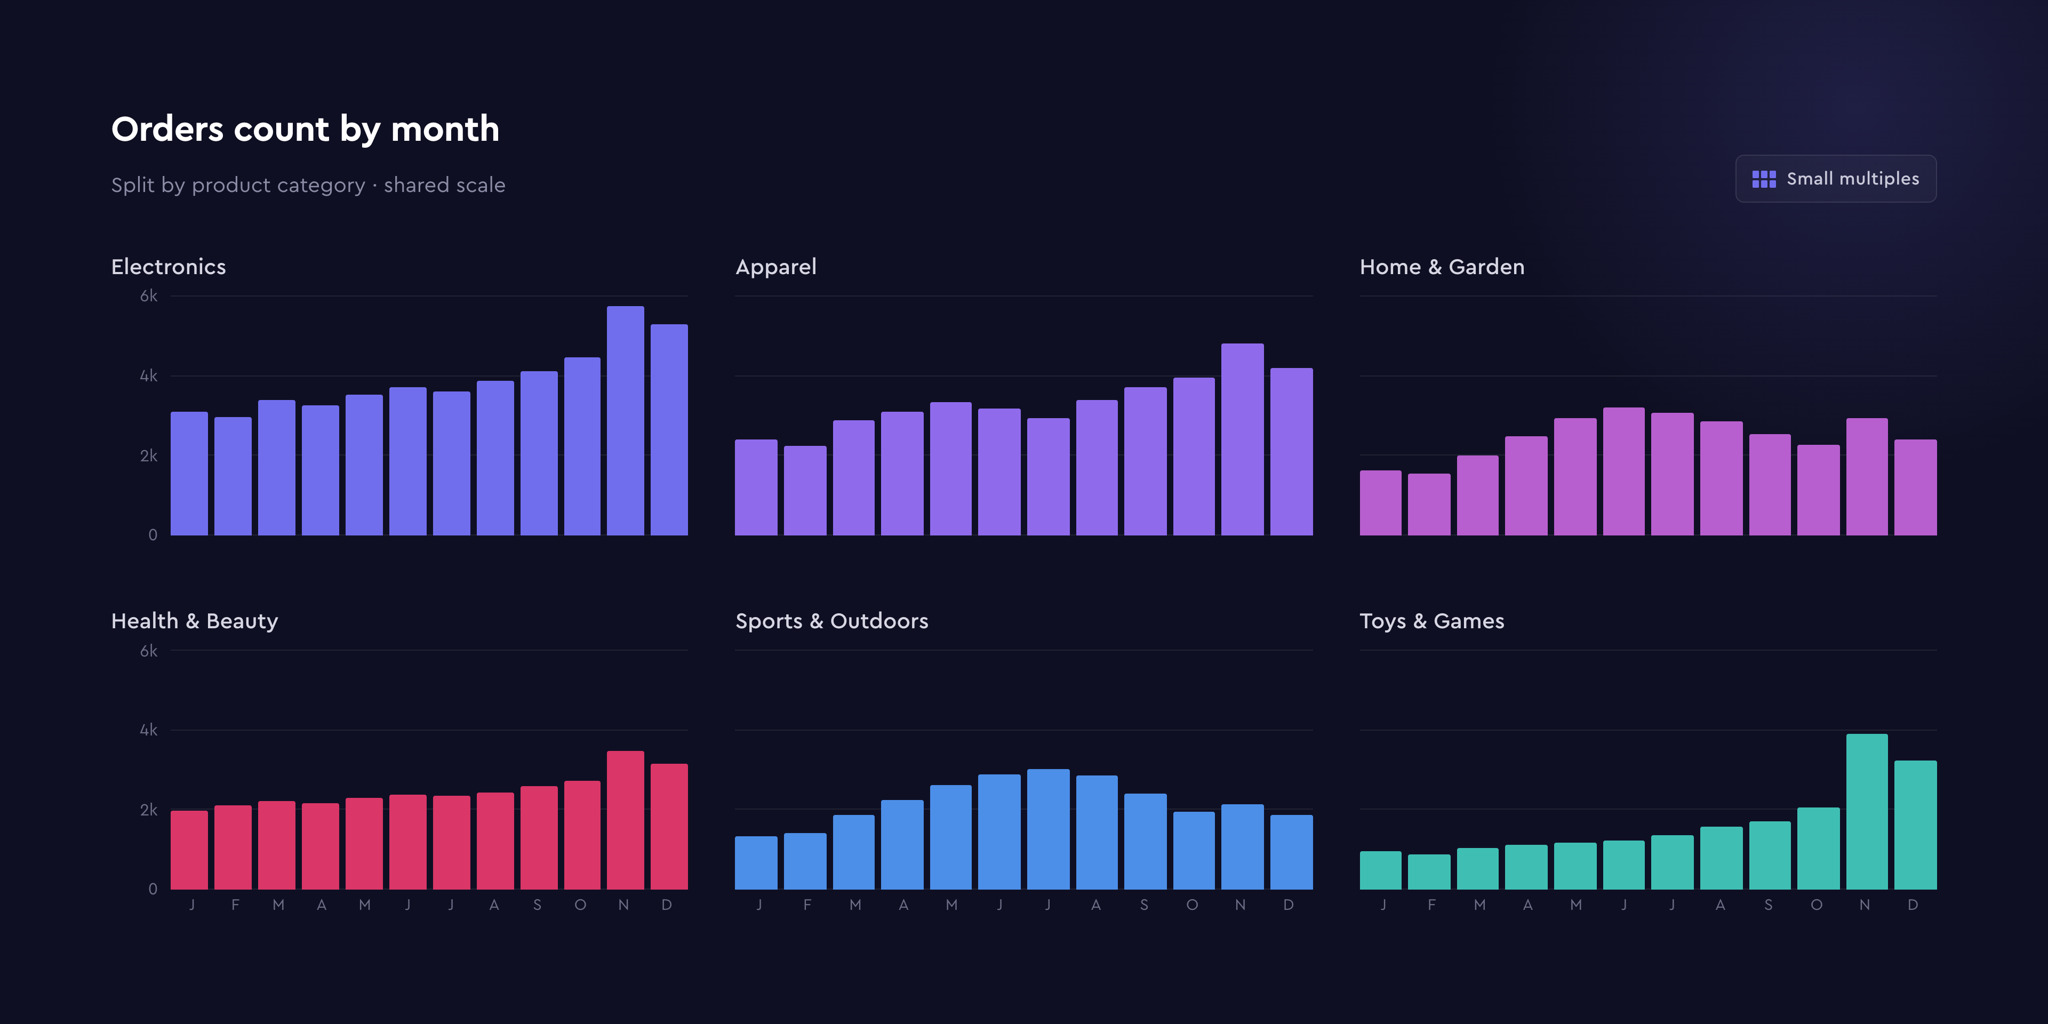
This week we shipped a lot of updates to charts and visualization — a new way to lay a chart out, a rebuilt pie, richer table formatting, and more control over how values look. Most of it lives in the chart settings panel you already use.
Small multiples splits a bar, line, area, or scatter chart into a grid of panels, one per value of a dimension you pick under Split by. Panels can share an axis scale or get their own, so you can compare magnitude or shape.
Pie charts got a rebuild. A slice can now show what percent of the total it is, right on its label. A shape control turns any pie into a donut. And a query with two or more dimensions draws as concentric rings — one ring per dimension, each broken down by the ring inside it — where before every dimension past the first was silently dropped.
On the Table chart, a dimension's links now open straight from the cell value instead of the context menu. Conditional formatting can mark a cell with an arrow, dash, or dot in its own color, so you can see at a glance which rows beat their target. And cell values can be aligned to the top, middle, or bottom of a row, which starts to matter once rows wrap onto more than one line.
KPI blocks can be styled one block at a time — value color, background, and font size. And a reference line can carry a text label, so a target line says what it is on the chart itself.
Other improvements and fixes:
Workbooks
- You can now filter a time member by calendar period — in the month, in the quarter, in the year, and their negations — on the report bar, the dashboard filter widget, and embedded Dashboards
- Period-over-period comparison can now anchor to a time dimension the query only filters on, so a report with no time column still compares against the preceding window
- An Explore chat thread now has its own URL, so you can link someone straight to the conversation
- The Generated SQL tab now lists the queries for every data source
Dashboards
- Filters you change on a published Dashboard are now reflected in the URL, so a filtered view can be bookmarked or shared
- You can now rename a dashboard theme from its menu
- The dashboard slug is now shown next to the title in the builder
- Fixed the freshness indicator being invisible on stylized Dashboards
Visualization
- Fixed conditional-formatting colors reading inverted in dark theme
- Fixed Table chart data bars not rendering on a numeric dimension
- Fixed a pie chart failing to regroup when its slice dimension is removed
- Fixed KPI change colors being ignored on published and embedded Dashboards, so a KPI already saved with them now renders the way it was configured
- Fixed KPI HTML blocks keeping their light-mode colors in dark theme when the color comes from row data
Administration
- Added a workspace-wide time zone policy under Admin → Settings, with a personal override in Preferences, so time dimensions bucket and relative filters resolve in the zone your readers actually work in (off by default)
- The deployment you are in is now marked in the deployment switcher
- You can now filter the user groups list to system groups
- You can now edit or delete the demo data source
- Fixed view-only users being offered workbook edit access they cannot use
AI
- Analytics Chat now answers in your workspace time zone rather than always in UTC, so "orders today" stops straddling the wrong midnight
- Added GPT-5.6 Sol and Terra, and fixed Cube-hosted GPT selections other than GPT-4o falling back to GPT-5
- Added MCP tools for branch diffs, pre-aggregation build status, and deployment environment variables
- Cube Agent Skills now apply inside the MCP chat tool
- Agent spaces are now scoped to a deployment, so dev, staging, and production can each declare the same space name and get their own
- Asking a data question now saves its result into the empty tab it was asked from
- The agent now duplicates a view-only Dashboard before editing it, instead of failing
Embed
- You can now set a time zone per embed instance with
?timezone=, at runtime from the host page, or as an account-wide default under Embed → Settings
- A crashing widget no longer takes down the whole Dashboard, and the AI widget no longer errors on embedded surfaces
- Fixed the embedded Creator Mode app reloading when a plan check ran
Integrations
- Compact numbers now reach the sheet as numbers rather than text in the Google Sheets and Excel add-ons
- Fixed Google Sheets converting text values into dates
Modeling
- You can now create a branch from an explicitly chosen source, including a branch that only exists on your remote
- Fixed Review changes in a dbt sync email opening an empty diff instead of the branch changes
- Fixed two measures on the same cube being refused when they need different join paths
- Fixed a multi-stage measure with its own
filter returning extra rows that carried null values for every other measure
- Fixed
FILTER_PARAMS failing to resolve member references inside a column callback
- Fixed ungrouped queries being answered from a pre-aggregation that collapses rows
API
cubeSql() and cubeSqlStream() in @cubejs-client/core now accept a timezone option- Fixed the last-refresh time going missing from SQL API responses that use post-processing or SQL pushdown