Define your metrics once, in one governed model
Inconsistent metric definitions are where trust in analytics breaks down. Model your metrics, dimensions, joins, and access rules once, upstream — so every dashboard, embedded app, and AI agent reads from the same governed definitions.




 and 50+
Define your model once — everything downstream reads from it
Whether the consumer is an internal dashboard, analytics embedded in your product, or an AI agent, it reads from the same governed model. Define “revenue,” “active user,” or “churn” once, upstream — instead of re-deriving them, differently, in every tool. One definition, the same number everywhere.
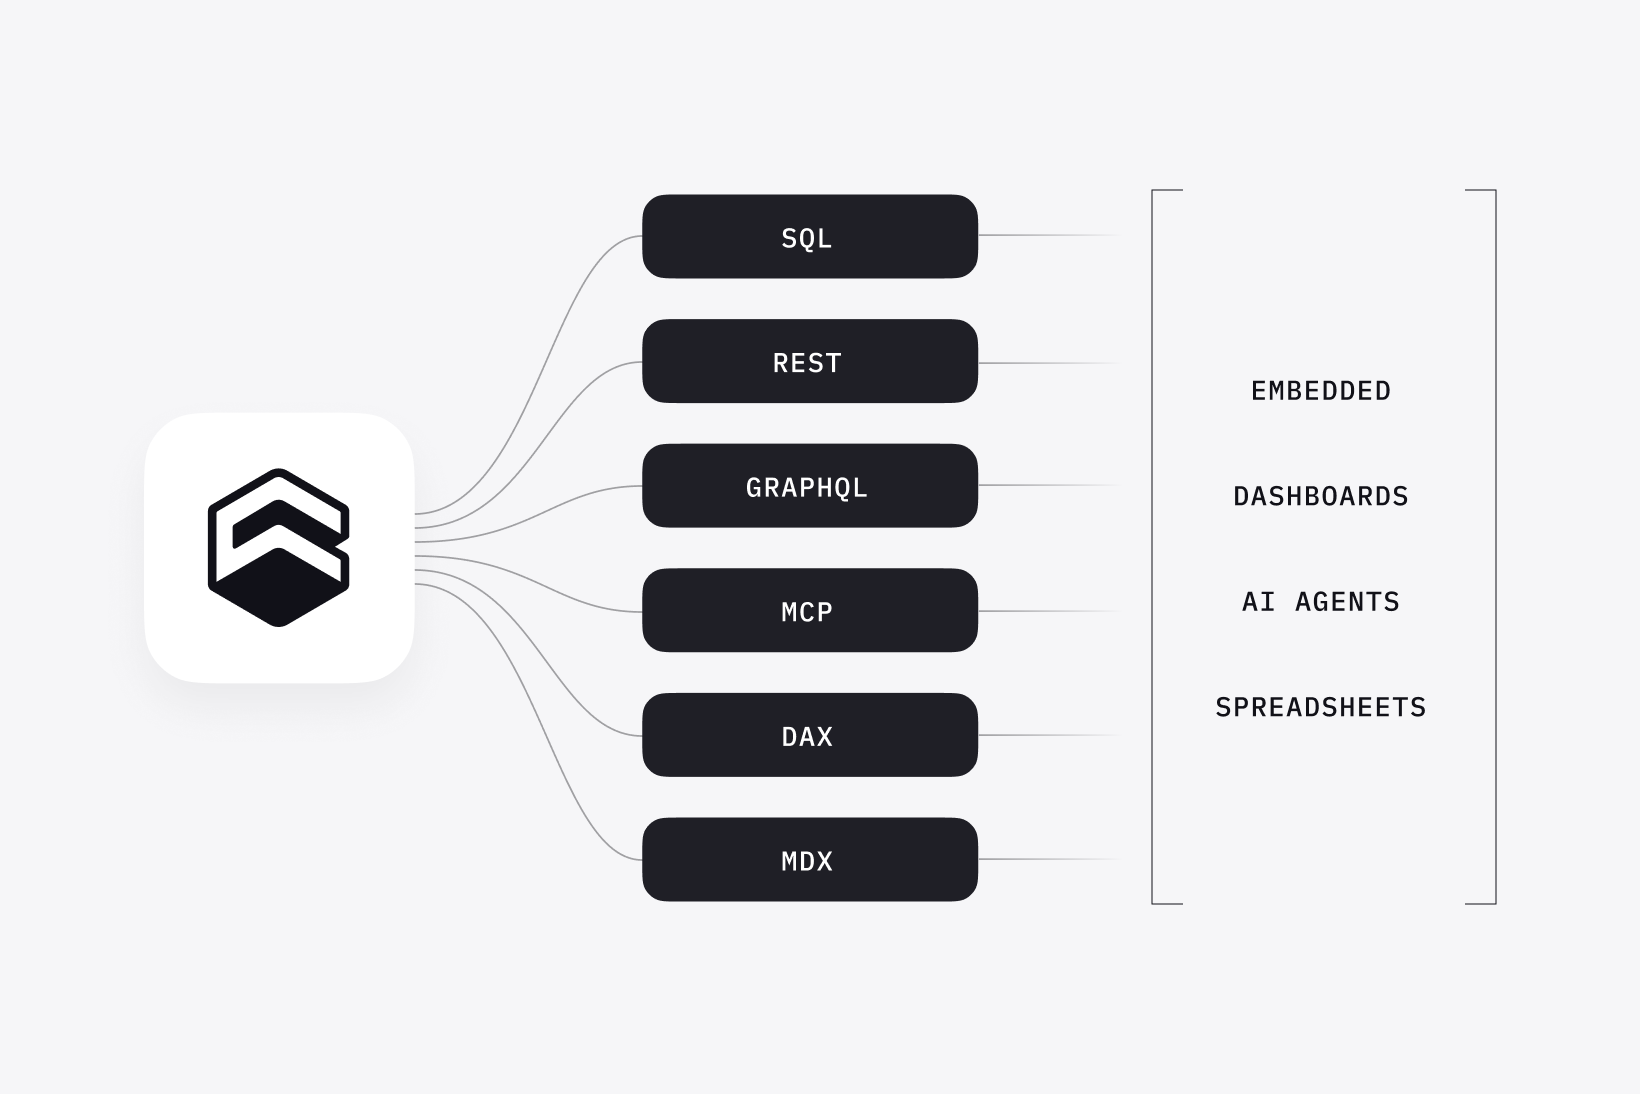
One governed model, every consumer
The model you define is served to every consumer — over a Postgres-compatible SQL API, REST, and GraphQL; to AI agents over the MCP server; and to spreadsheets over the DAX and MDX APIs. Model in Python, JavaScript, or YAML — whatever a consumer reads, it reads your governed definitions, not a re-implementation of them.
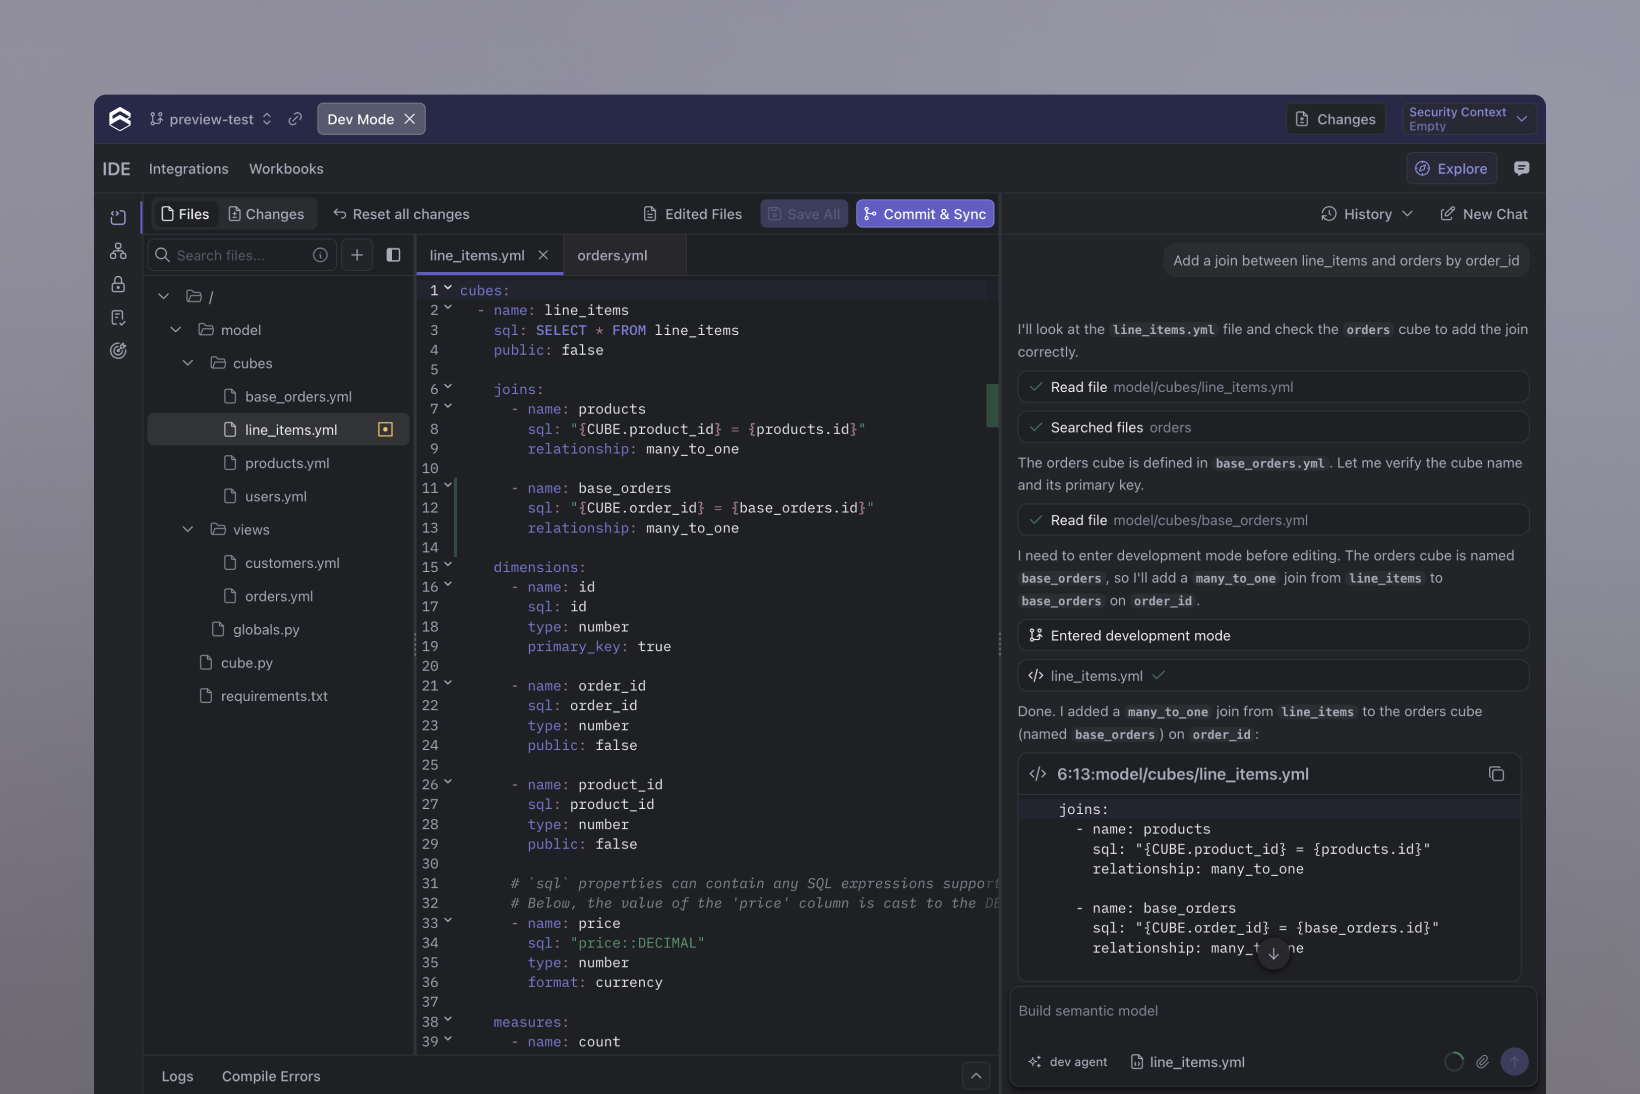
Build the model with real engineering tools
Author and iterate in the Data Model IDE, prototype against live data in the Playground, and test changes in development mode before they reach production — with AI assistance from Cube Copilot. Version-control your model, review it, and ship it through CI/CD, the way you ship the rest of your code.
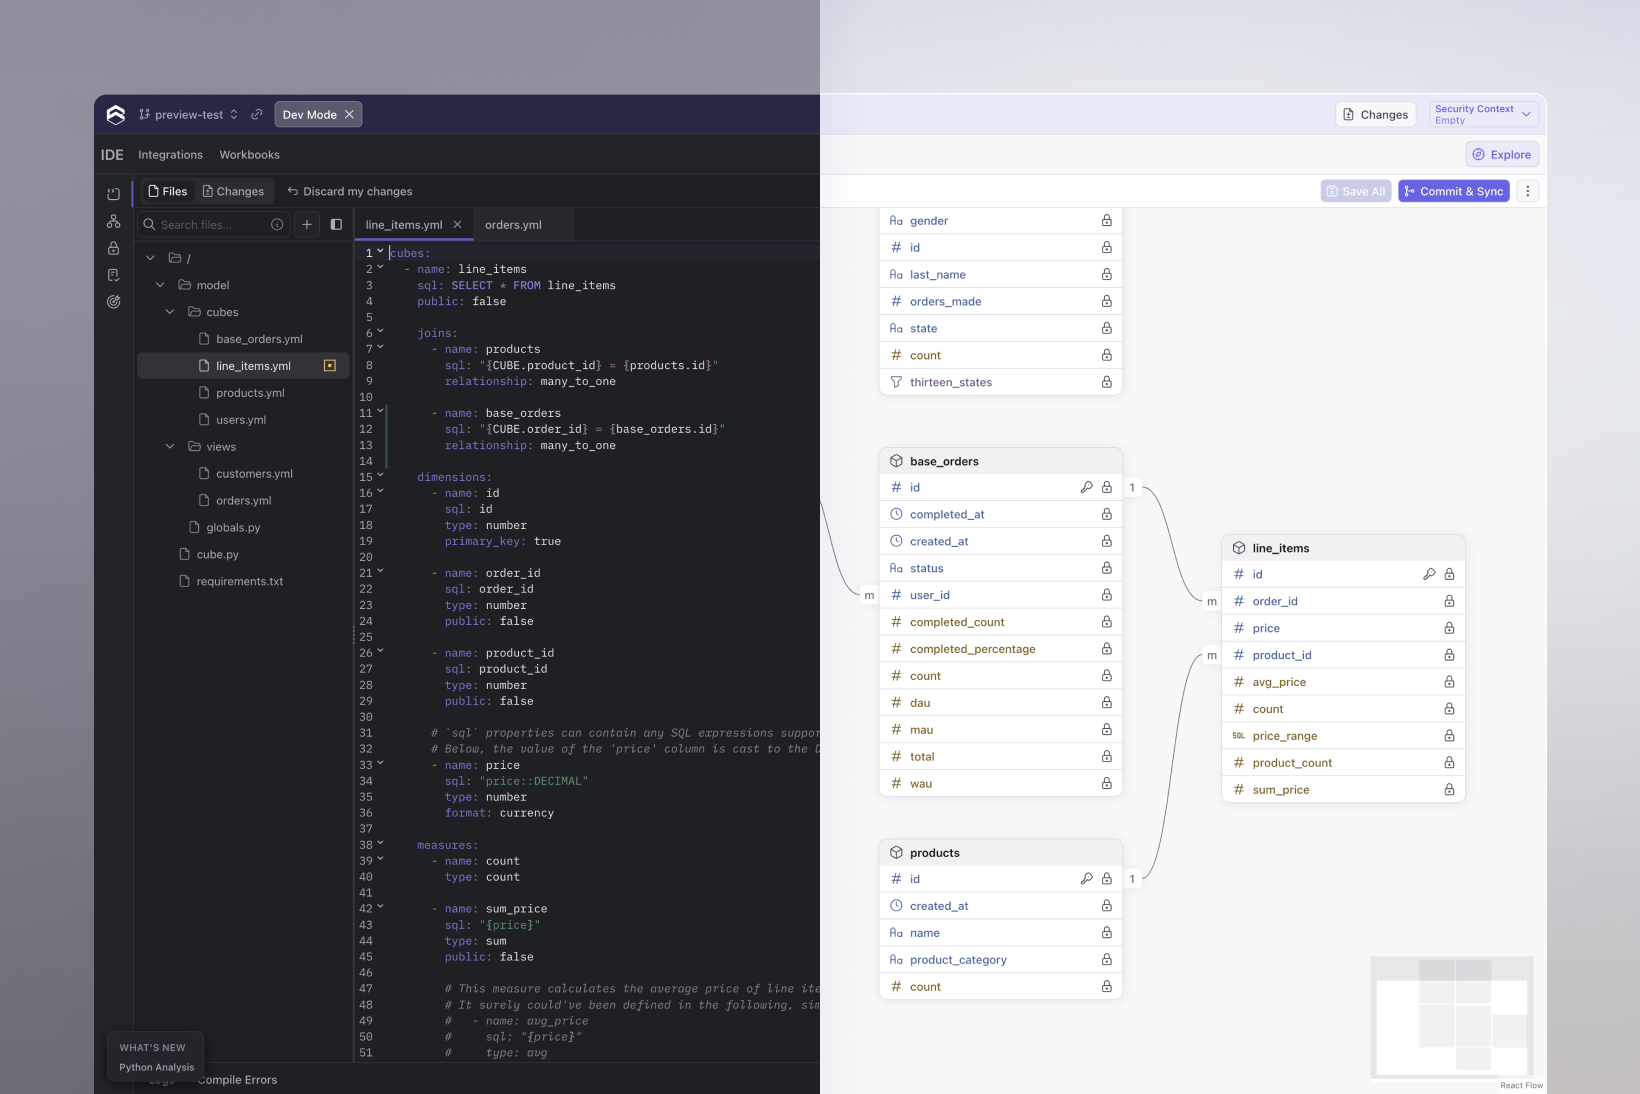
Model in code or visually, in one workspace
Work code-first, or build visually with Visual Modeler — the two stay in sync. Data engineers and analysts collaborate on one source of truth, creating and editing cubes and views, joins, relationships, dimensions, and measures by clicking or in code.
How data modeling with Cube works
views:- name: active_usersdescription: 14 days rolling count of active usersincludes:# Measure- users.rolling_count# Dimensions- users.is_paying- users.signup_date- name: company.namealias: company_name
Building Your Data Model
Cube is a dataset-oriented semantic layer. When building your data model, you'll deal with two types of objects: cubes and views.
Cubes represent business entities such as customers, line items, and orders. In cubes, you define all the hierarchies, calculations, and folders using dimensions and measures.
All cubes within your data model constitute your data graph.
views:- name: active_users_viewpublic: COMPILE_CONTEXT.security_context.is_financecubes:- join_path: active_usersincludes:- weekly_active- time- join_path: accountsincludes:- pricing_plan
Views expose slices of your data graph
You have full control over which measures and dimensions are exposed to BIs or data apps and the direction of joins between exposed cubes.
Cube's core data modeling concepts can be easily grasped by former Looker users, familiar with LookML syntax.
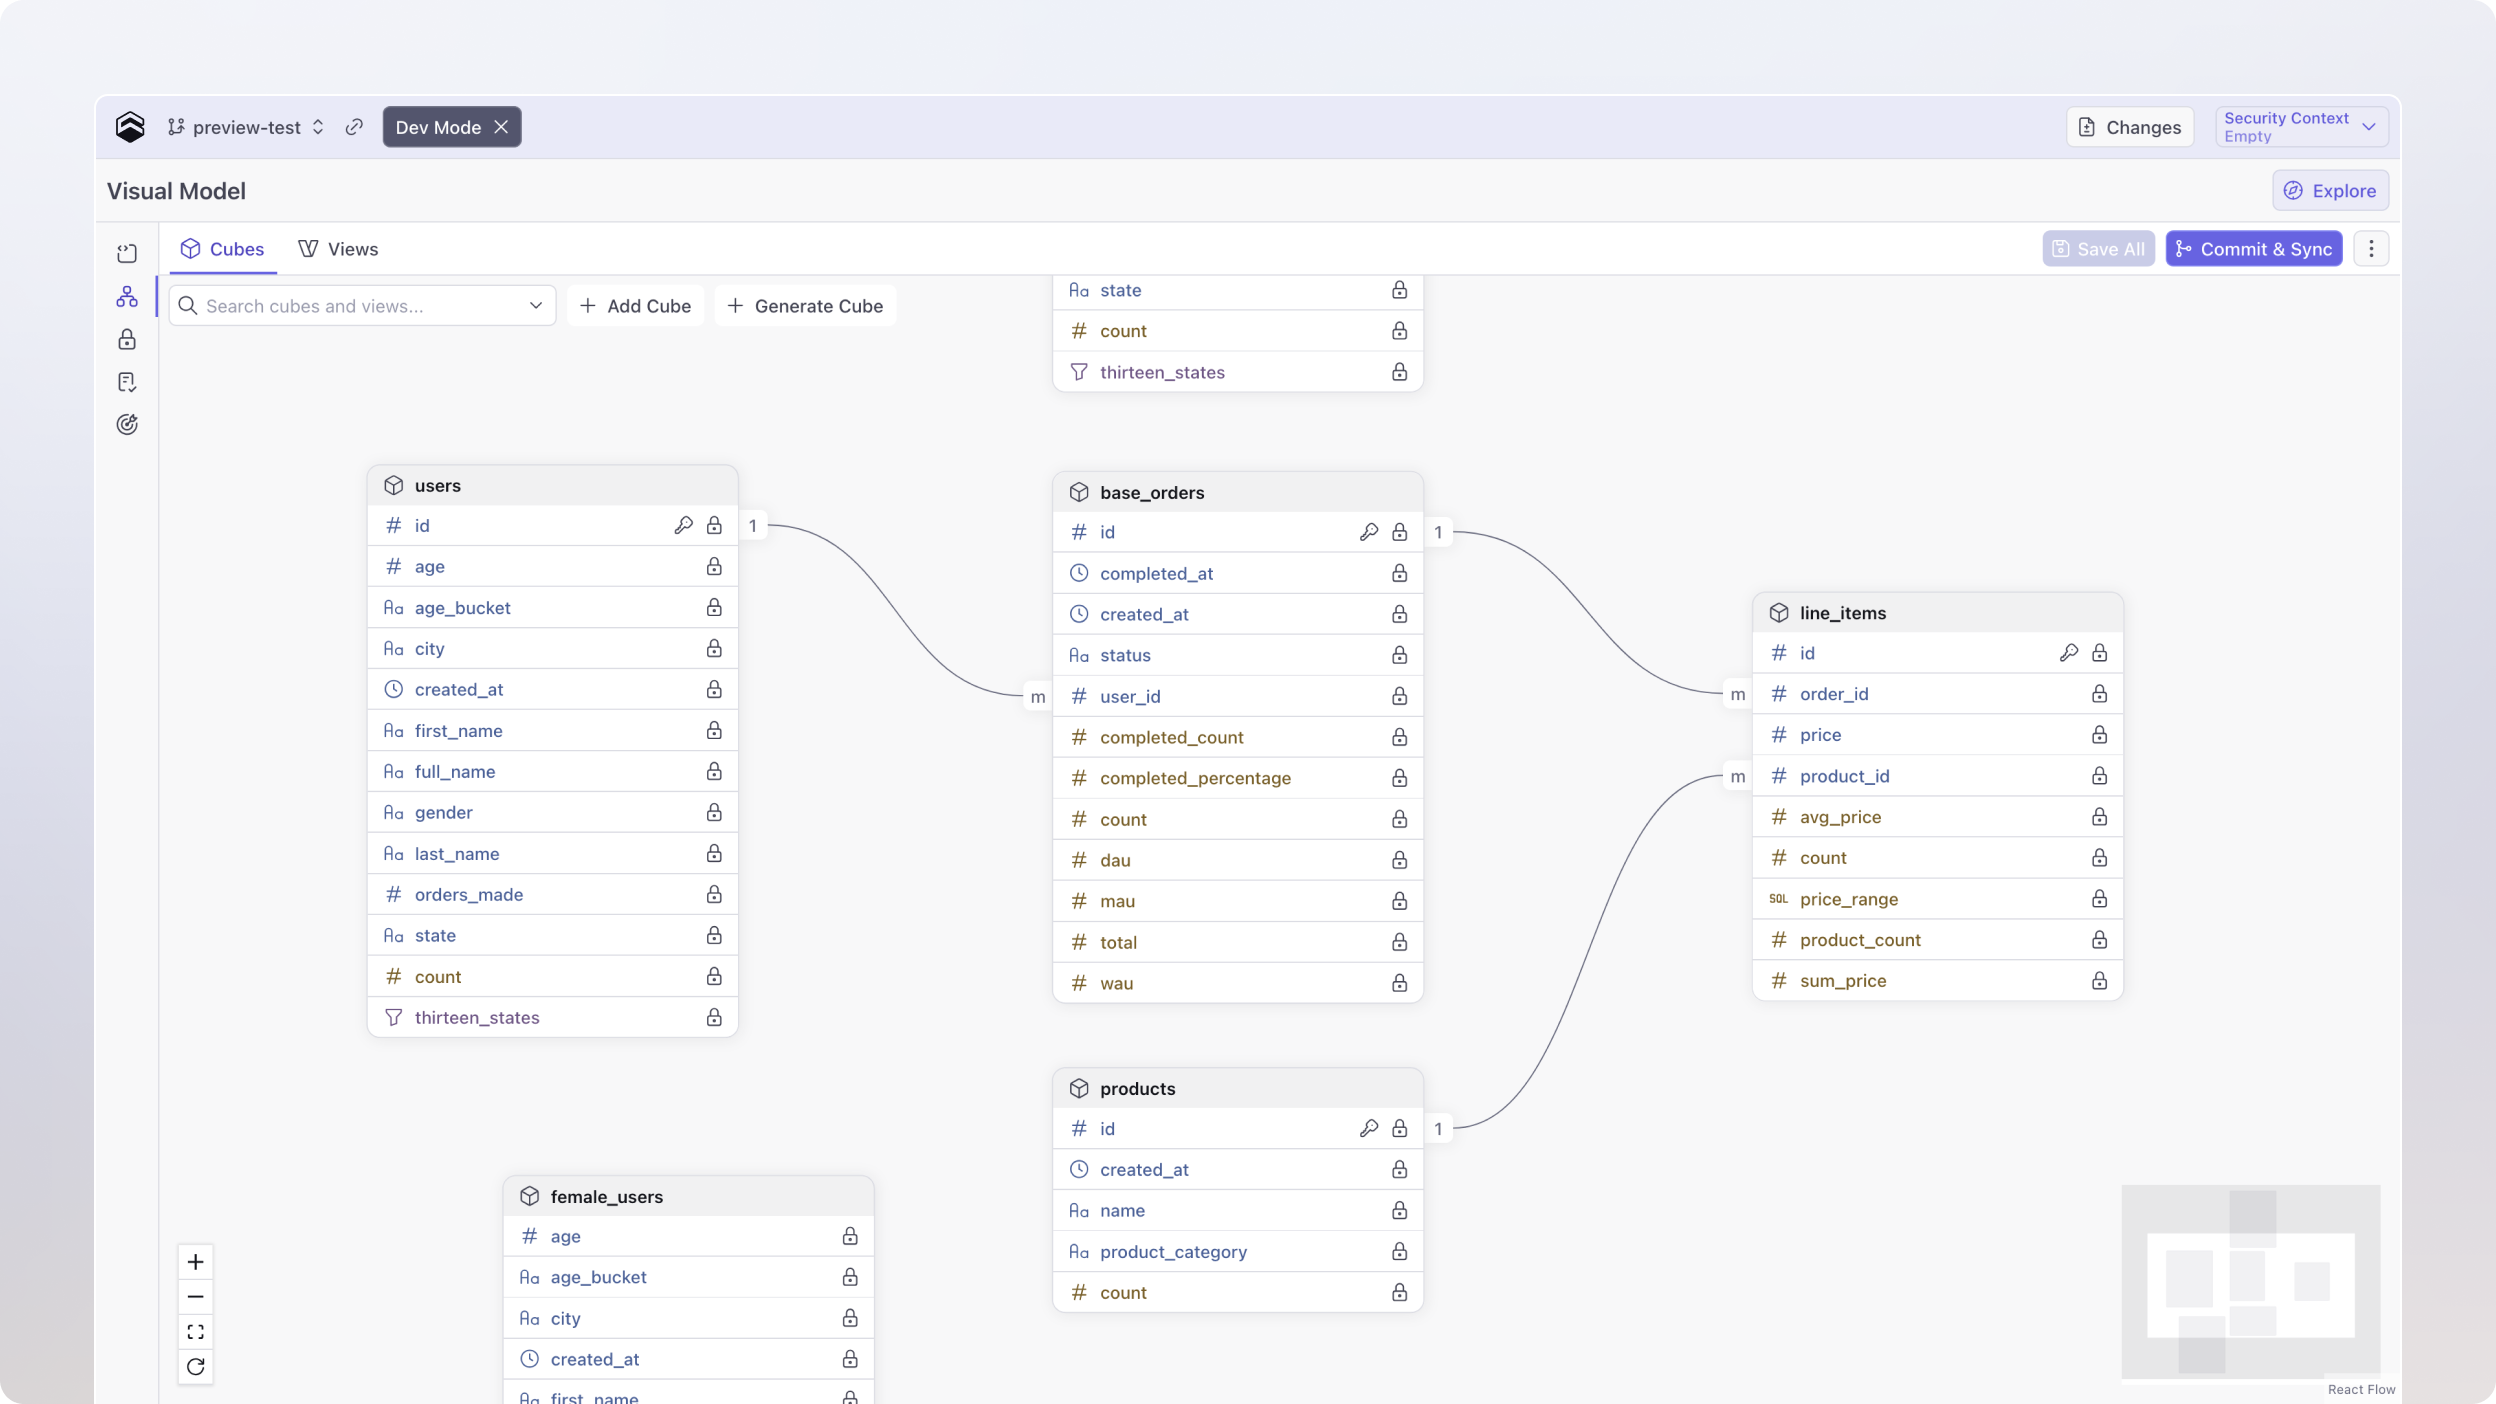
Bird's-eye view of the model, editable in place
Visual Modeler lays out your cubes and views as an entity-relationship diagram: pan and zoom across the model, create joins by dragging between cubes, and add dimensions, measures, and access policies without writing code. Edits open in development mode, so nothing reaches production until you ship it.
“With Cube, we've reduced the time required to generate real-time and historical reports from 10's of seconds to less than 2, while reducing our spending on hosting by almost 80%.”

