Cross-filtering
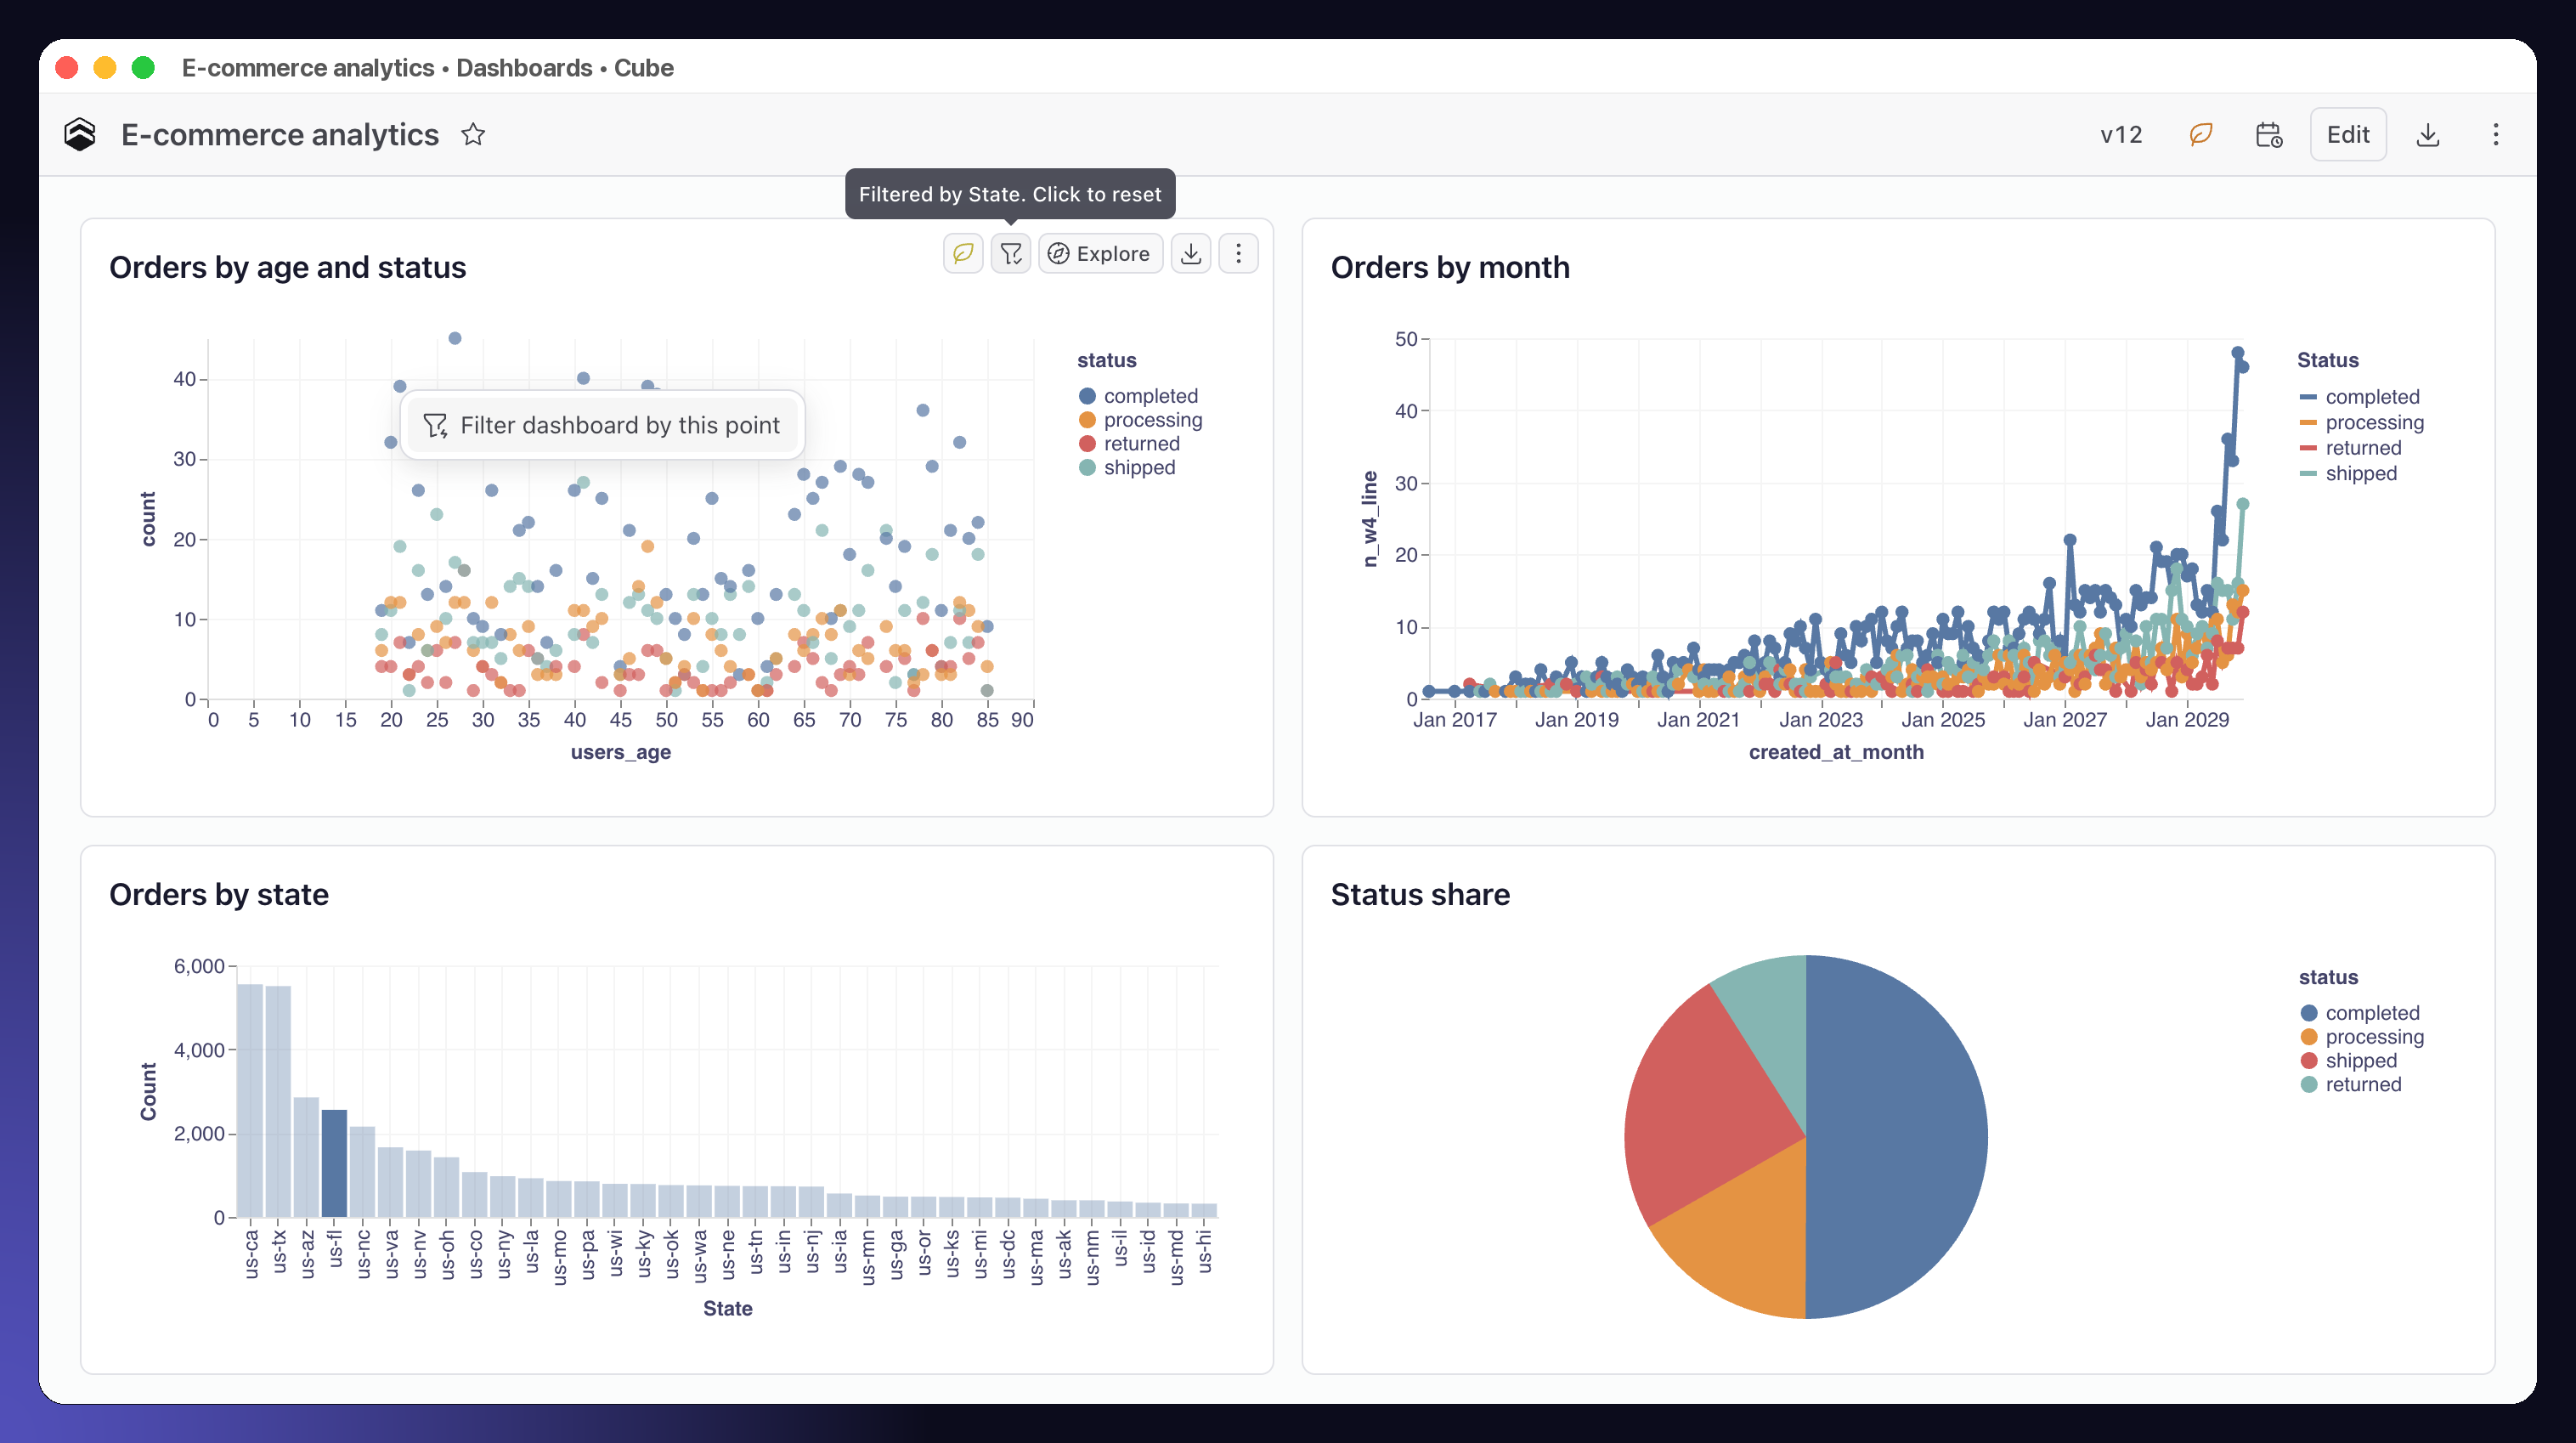
You can now let viewers filter a Dashboard by clicking its charts. In the dashboard builder, turn on Cross-filtering on the Editing tab of the dashboard options, then publish. A viewer can click a bar, a pie slice, a map region, a table cell, or a point on a line or scatter chart and choose Filter dashboard by this point. Every other chart re-runs with that filter, and the chart they clicked dims the data outside the selection.
Cmd/Ctrl+click adds or removes values, and dragging along a date or numeric axis selects a range. Cross-filters are kept in the URL, so they survive a reload, travel with Copy link, and reach the Dashboard Agent. Cross-filtering works on published Dashboards in Cube and on embedded Dashboards.
Other improvements and fixes:
Workbooks
- You can now create a duration field between two time dimensions from the Data Pane
- New workbook tabs now get a title from their first query, which keeps following the query until you rename the tab
- Group values now suggests a name for the group from the values you select
- Table headers and CSV exports now use the column aliases from your Semantic SQL query
Dashboards
Scheduled refreshes now include the controls that viewers added with Dynamic controls.
Visualization
- Line and Area charts now work on any dimension, not only time dimensions
- Charts with too many data points to read now show a notice, with an option to draw them anyway
- Added a labelled Orientation setting to the Fields tab of bar, line and area charts
AI
- You can now install Cube from the Claude Connectors Directory and from the ChatGPT and Codex plugin directories
- Backend apps can now authenticate with a Cube API key to use the MCP server
- Added an optional small model for BYOM, used for side tasks such as suggested questions and memory
- Analytics Chat can now create KPI charts with a sparkline or a progress bar
- Attachments and skills in the chat composer moved to a new + menu
Embed
Fixed calculated fields not saving in Creator Mode.
Integrations
- Added VAR.S, VAR.P, VARX.P, and EOMONTH support in DAX for Power BI
- Fixed numeric dimension members showing as text and sorting alphabetically in Excel PivotTables
Modeling
- Filters on switch dimensions now list values in the order they are declared in the data model
- Fixed Microsoft SQL Server weeks starting on Sunday instead of Monday
- Fixed ClickHouse time dimensions and time range filters losing sub-second precision
API
/v1/cubesql now supports a columnar response format.