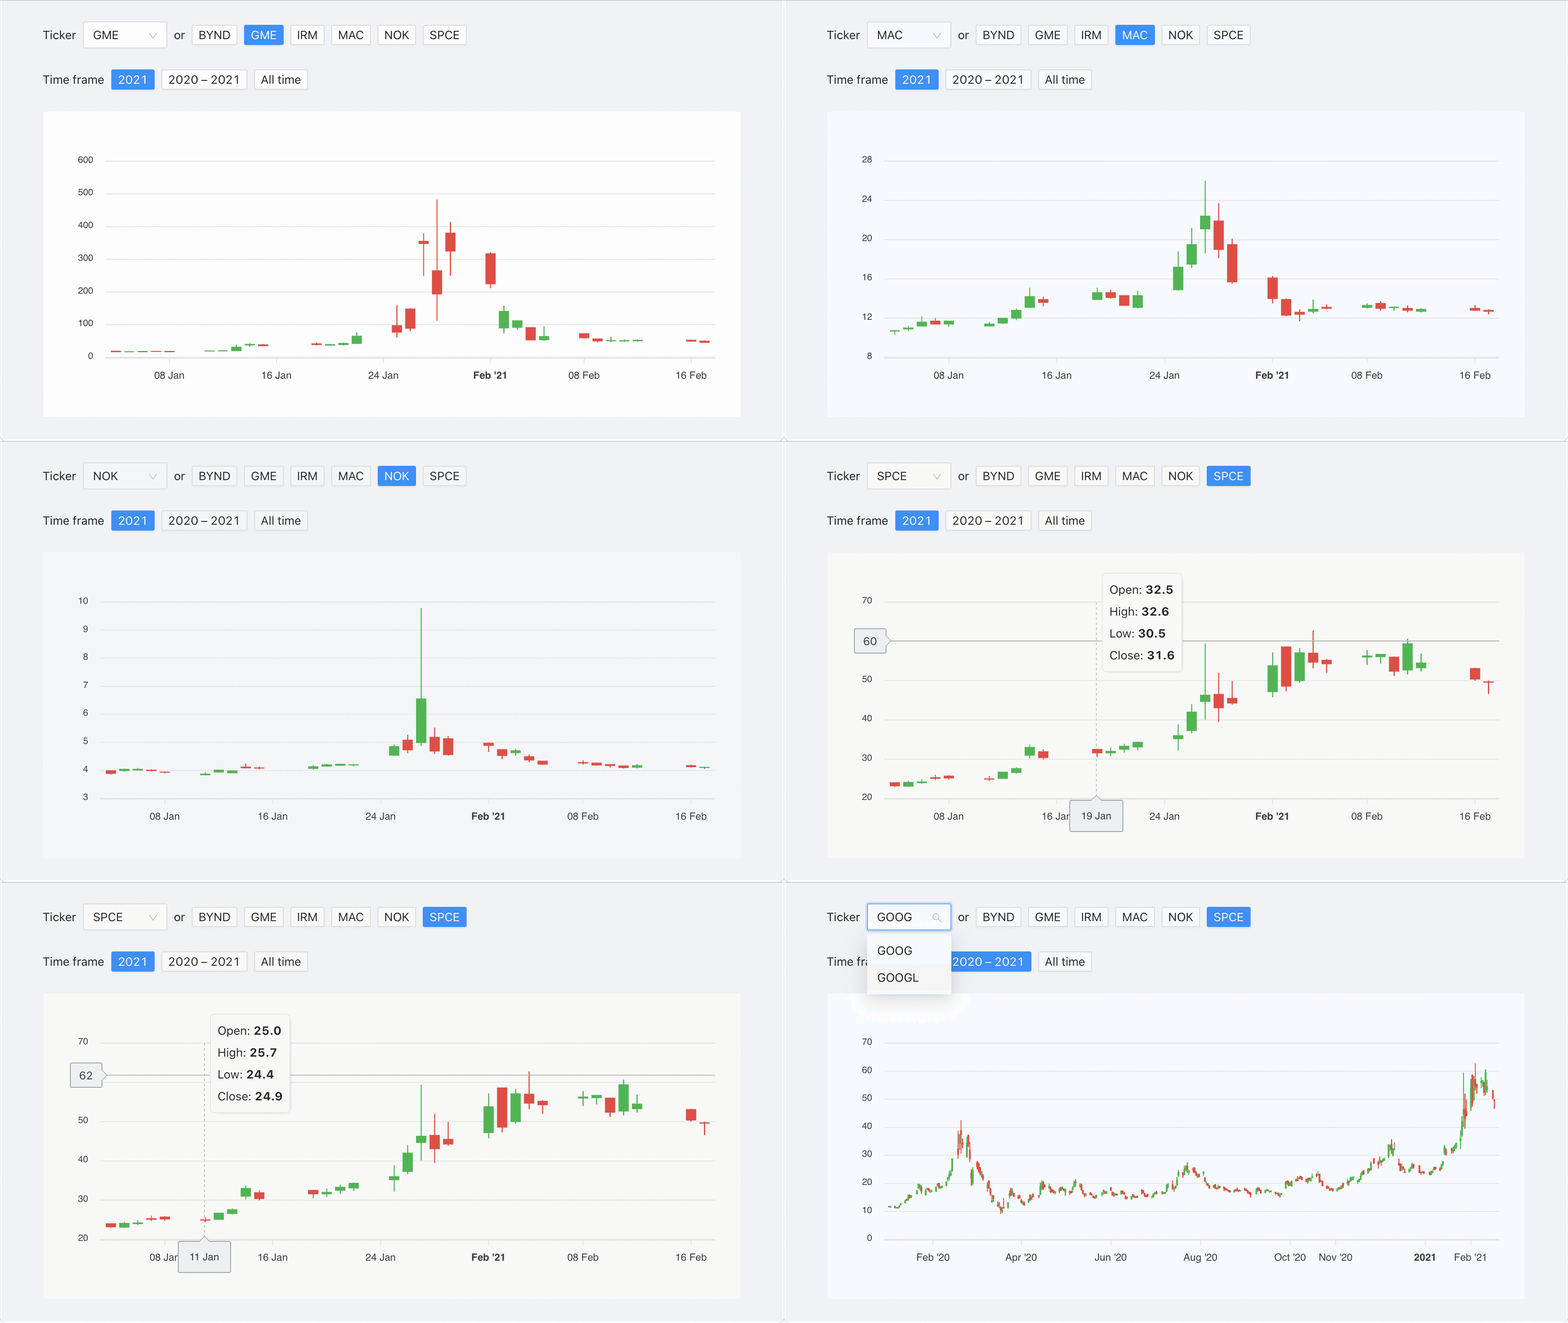
In this tutorial we'll explore how to create a dashboard on top of ClickHouse, a fast open-source analytical database. We'll build a stock market data visualization with candlestick charts, learn the impact of WallStreetBets, and observe how fast ClickHouse works.
What is ClickHouse?
ClickHouse is a fast open-source column-oriented analytical database. Unlike transactional databases like Postgres or MySQL, it claims to be able to generate analytical reports using SQL queries in real-time.
While relatively obscure, ClickHouse is adopted and used at Bloomberg, Cloudflare, eBay, Spotify, Uber, and even by nuclear physicists at CERN.
Also, it claims to be blazing fast due to its columnar storage engine. Sounds legit, because it's generally faster to apply analytical operations such as AVG, DISTINCT, or MIN to densely packed values (columns) rather than sparsely kept data.
In this tutorial we're going to explore how to:
- start working with ClickHouse,
- build an analytical API on top of it with Cube, and
- query this API from a front-end dashboard, so you can
- visualize query results with charts.
Here's what our end result will look like:

Also, here's the live demo you can use right away. And yeah, you surely can use it to observe drastic price surges of the stocks that were popular on the WallStreetBets subreddit, including GameStop.
We're taking off, so fasten your seatbelts! ✈️
How to Run ClickHouse
Surprisingly, there're plenty of options to get started with ClickHouse:
Install and run ClickHouse on your macOS or Linux developer machine. It's good for testing purposes, but somewhat suboptimal if you want to get trustworthy insights about production-like ClickHouse performance.
Install and run ClickHouse on AWS, GCP, or any other cloud computing platform. It's great for testing and production use, especially if you (or your company) already have active accounts there. While setting up ClickHouse in AWS EC2 from scratch is easy, there's also a ready-to-use ClickHouse container for AWS EKS.

Run managed ClickHouse in Yandex Cloud, yet another cloud computing platform. It's also a great option for testing and production use. First, ClickHouse was originally developed and open-sourced by Yandex, a large technology company, in June 2016. Second, setting up ClickHouse in Yandex Cloud in a fully managed fashion will require less time and effort.

And that's not all! You can also...
Use ClickHouse Playground, a publicly available read-only installation with a web console and API access. While it doesn't allow to run INSERT or data-definition queries such as CREATE TABLE, ClickHouse Playground is a great zero-setup tool to start working with ClickHouse.

Already have a ClickHouse installation? Great! You can use your own credentials to proceed with this tutorial. Otherwise, we'll use these readily available credentials from ClickHouse Playground:

We're almost at 35,000 feet, so get ready for your snack! ✈️
How to Run an Analytical API
Let's go step by step and figure out how we can work with ClickHouse in our own application of any kind.
How to send queries to ClickHouse? It provides two interfaces, HTTP and Native TCP. However, rarely you want to work with low-level raw HTTP or binary TCP data, right?
Are there any client libraries? ClickHouse has a few officially supported drivers (e.g., for C++) and a variety of libraries for different languages. You can use them to send SQL queries and get the results.
Is it possible to stay high-level, and even not bother to write and maintain SQL queries? Sure. Here's when Cube comes to the stage. Cube is an open-source analytical API platform, and it allows you to create an API over any database, ClickHouse included. You can use Cube.js to take your high-level domain-specific queries (similar to "I want to know average salary for every position" or "Show me count of purchases for every product category"), efficiently execute them against your database (casually getting predictable, low-latency performance), and get the result which can be easily visualized, e.g., plotted on a dashboard. And you also get Cube.js Developer Playground, a visual tool which helps to build queries and put them on charts with ease. Let's try it.
The first step is to create a new Cube project. Here I assume that you already have Node.js installed on your machine. Note that you can also use Docker to run Cube.js. Run in your console:
Now you have your new Cube project in the clickhouse-dashboard folder which contains a few files. Let's navigate to this folder.
The second step is to add ClickHouse credentials to the .env file. Cube will pick up its configuration options from this file. Let's put the credentials from ClickHouse Playground there. Make sure your .env file looks like this, or specify your own credentials:
Here's what all these options mean:
- Obviously,
CUBEJS_DB_TYPEsays we'll be connecting to ClickHouse. CUBEJS_DB_HOSTandCUBEJS_DB_PORTspecify where our ClickHouse instance is running, andCUBEJS_DB_SSLturns on secure communications over TLS.CUBEJS_DB_USERandCUBEJS_DB_PASSare used to authenticate the user to ClickHouse.CUBEJS_DB_NAMEis the database (or "schema") name where all data tables are kept together.CUBEJS_DB_CLICKHOUSE_READONLYis an option that we need to provide specifically because we're connecting to ClickHouse Playground because it allows only read-only access. Usually you won't need to specify such an option for ClickHouse.- The rest of options configure Cube and have nothing to do with ClickHouse.
The third step is to start Cube. Run in your console:
And that's it! Here's what you should see:

We've reached the cruising speed, so enjoy your flight! ✈️
How to Explore the Data
As the console output suggests, let's navigate to localhost:4000 and behold Cube Developer Playground. It provides a lot of features, but we have a clear path to follow.
First, let's generate the data schema. To do so, go to the "Schema" tab, select all necessary tables, and click "Generate Schema".

The data schema is a high-level domain-specific description of your data. It allows you to skip writing SQL queries and rely on Cube query generation engine. You can see how the data schema files look like if you go to HitsV1.js or VisitsV1.js files in the sidebar.
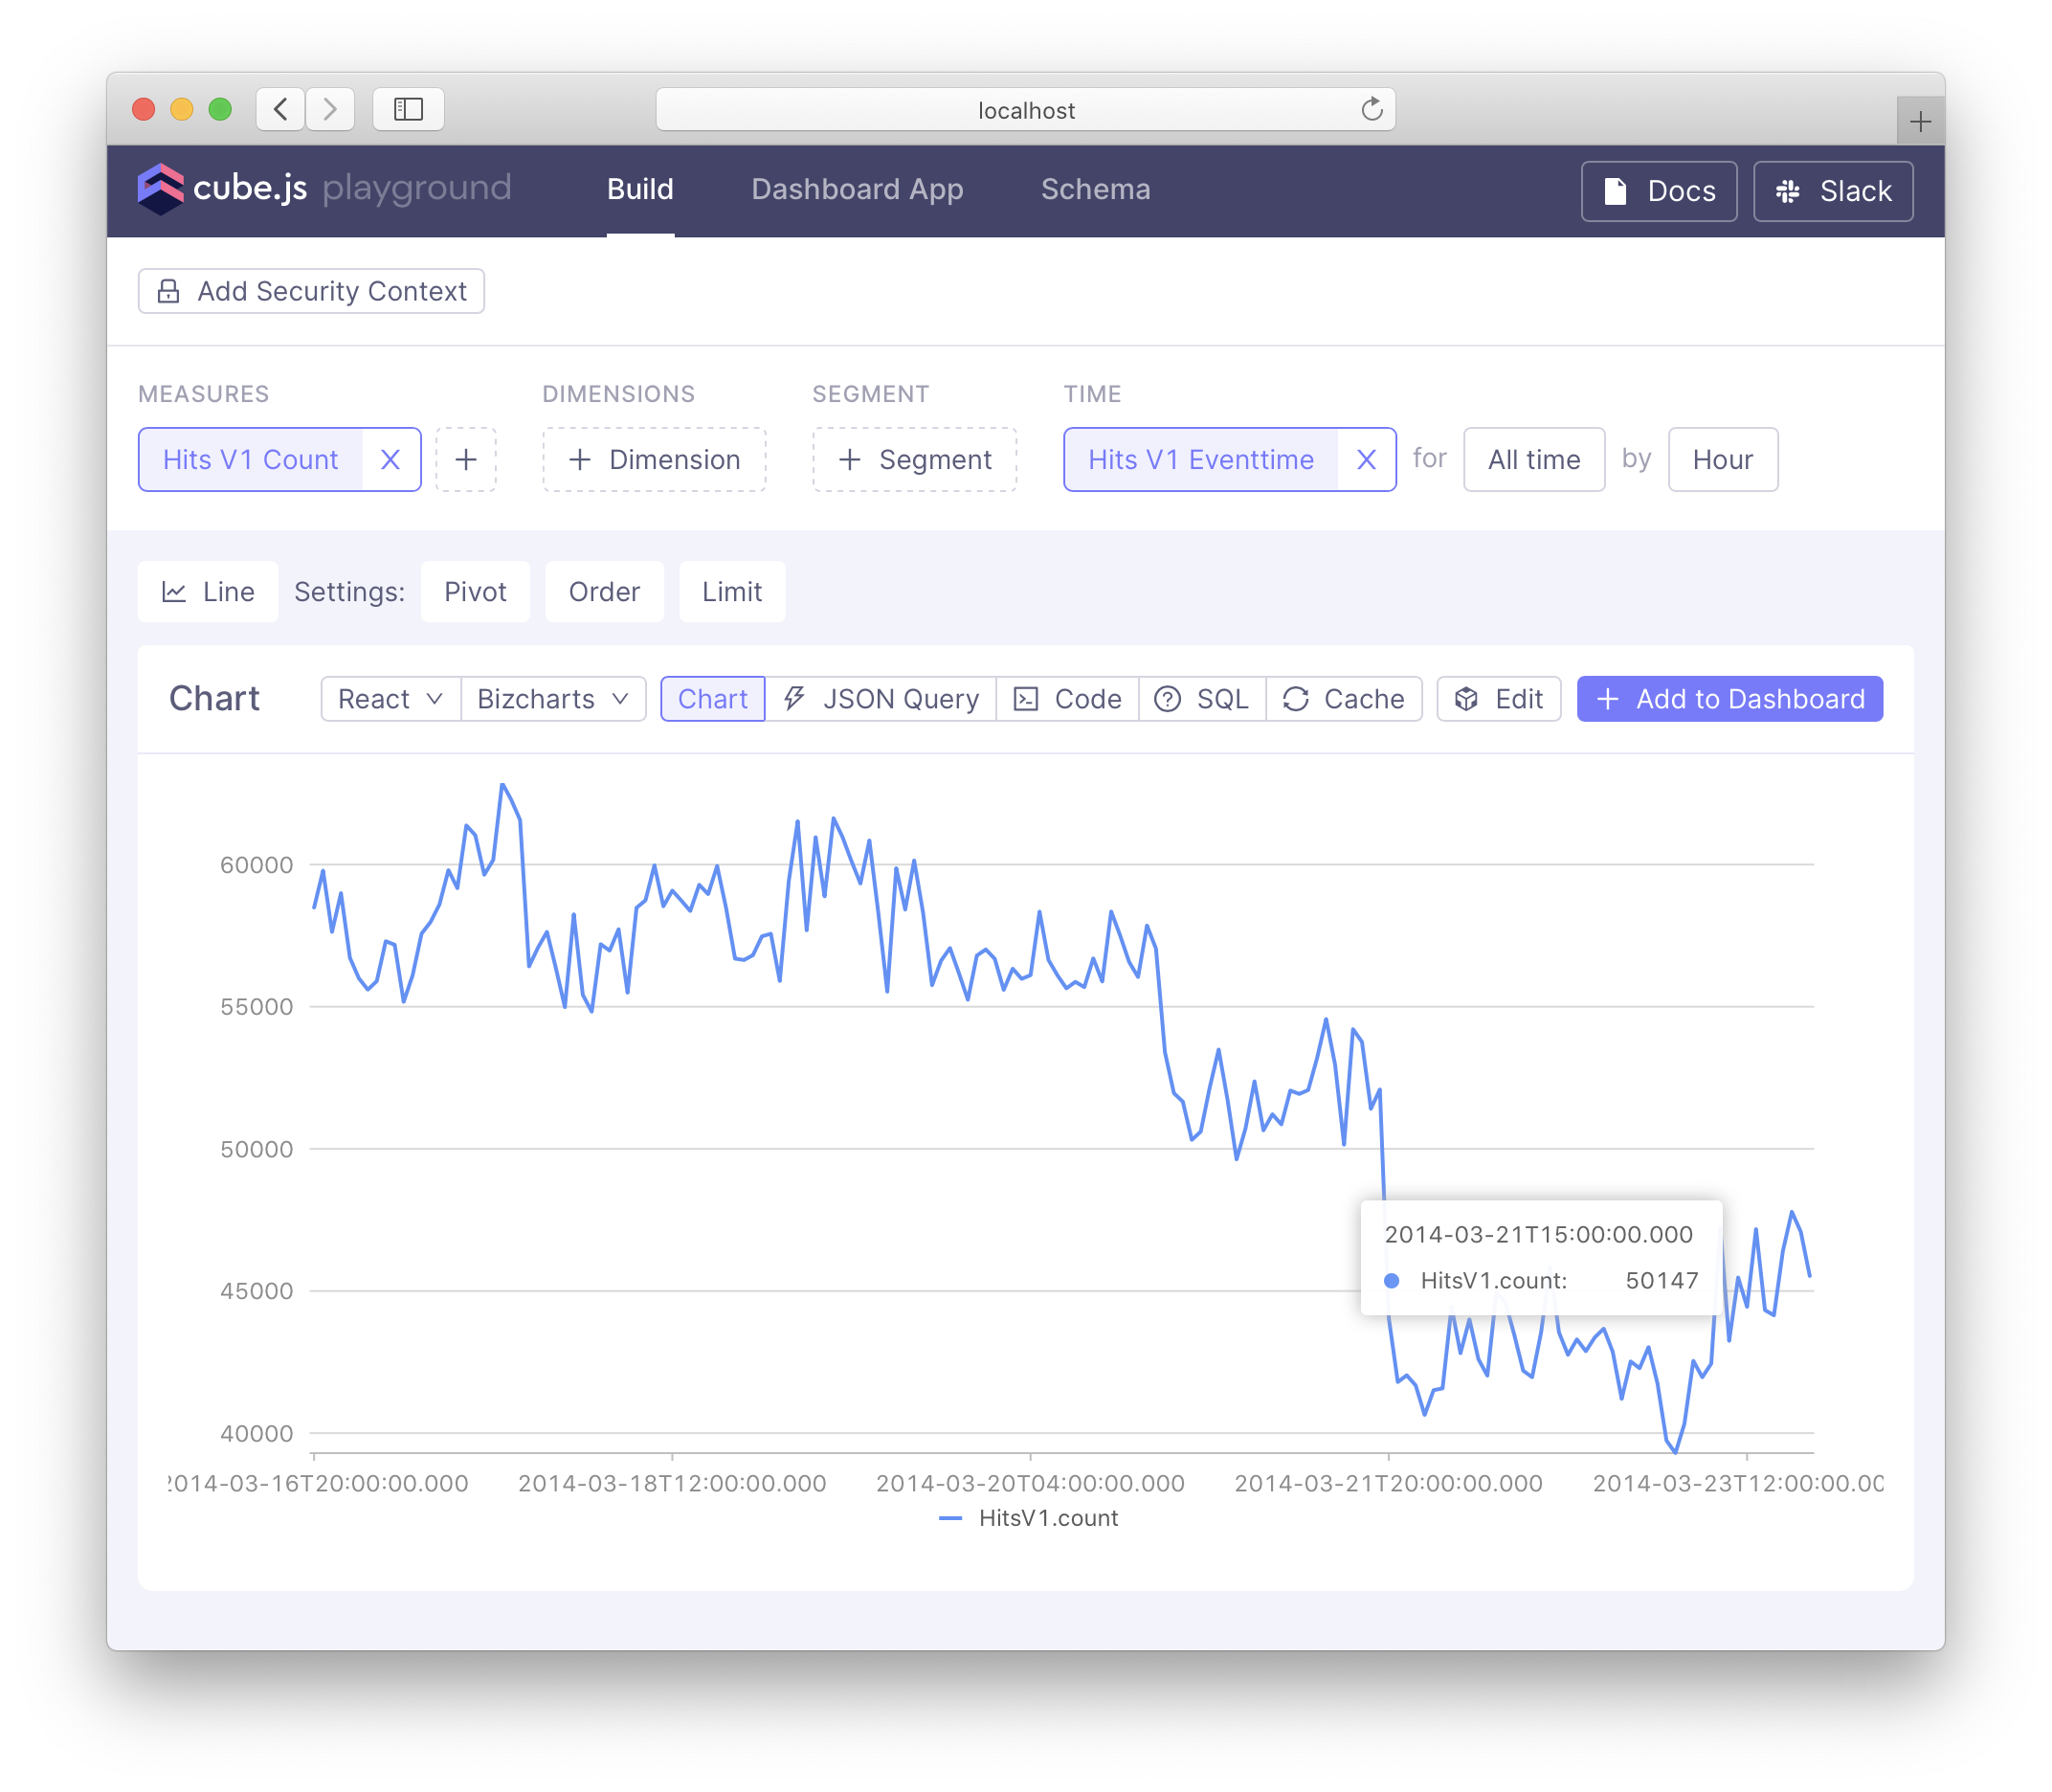
Second, let's build a query. To do so, go to the "Build" tab, click "+ Measure", and select a measure. For example, select Hits V1 Count. Our dataset is all about web traffic: web page hits and user visits. As you can see, the "Hits V1 Eventtime" time dimension has been automatically selected, and the chart below displays the count of page hits for every day from 2014-03-16 to 2014-03-23. What an old dataset that is! Want to see more data points? Click "Day" and select "Hour" instead. Now it's more interesting!

Definitely feel free to experiment and try your own queries, measures, dimensions, time dimensions, and filters.
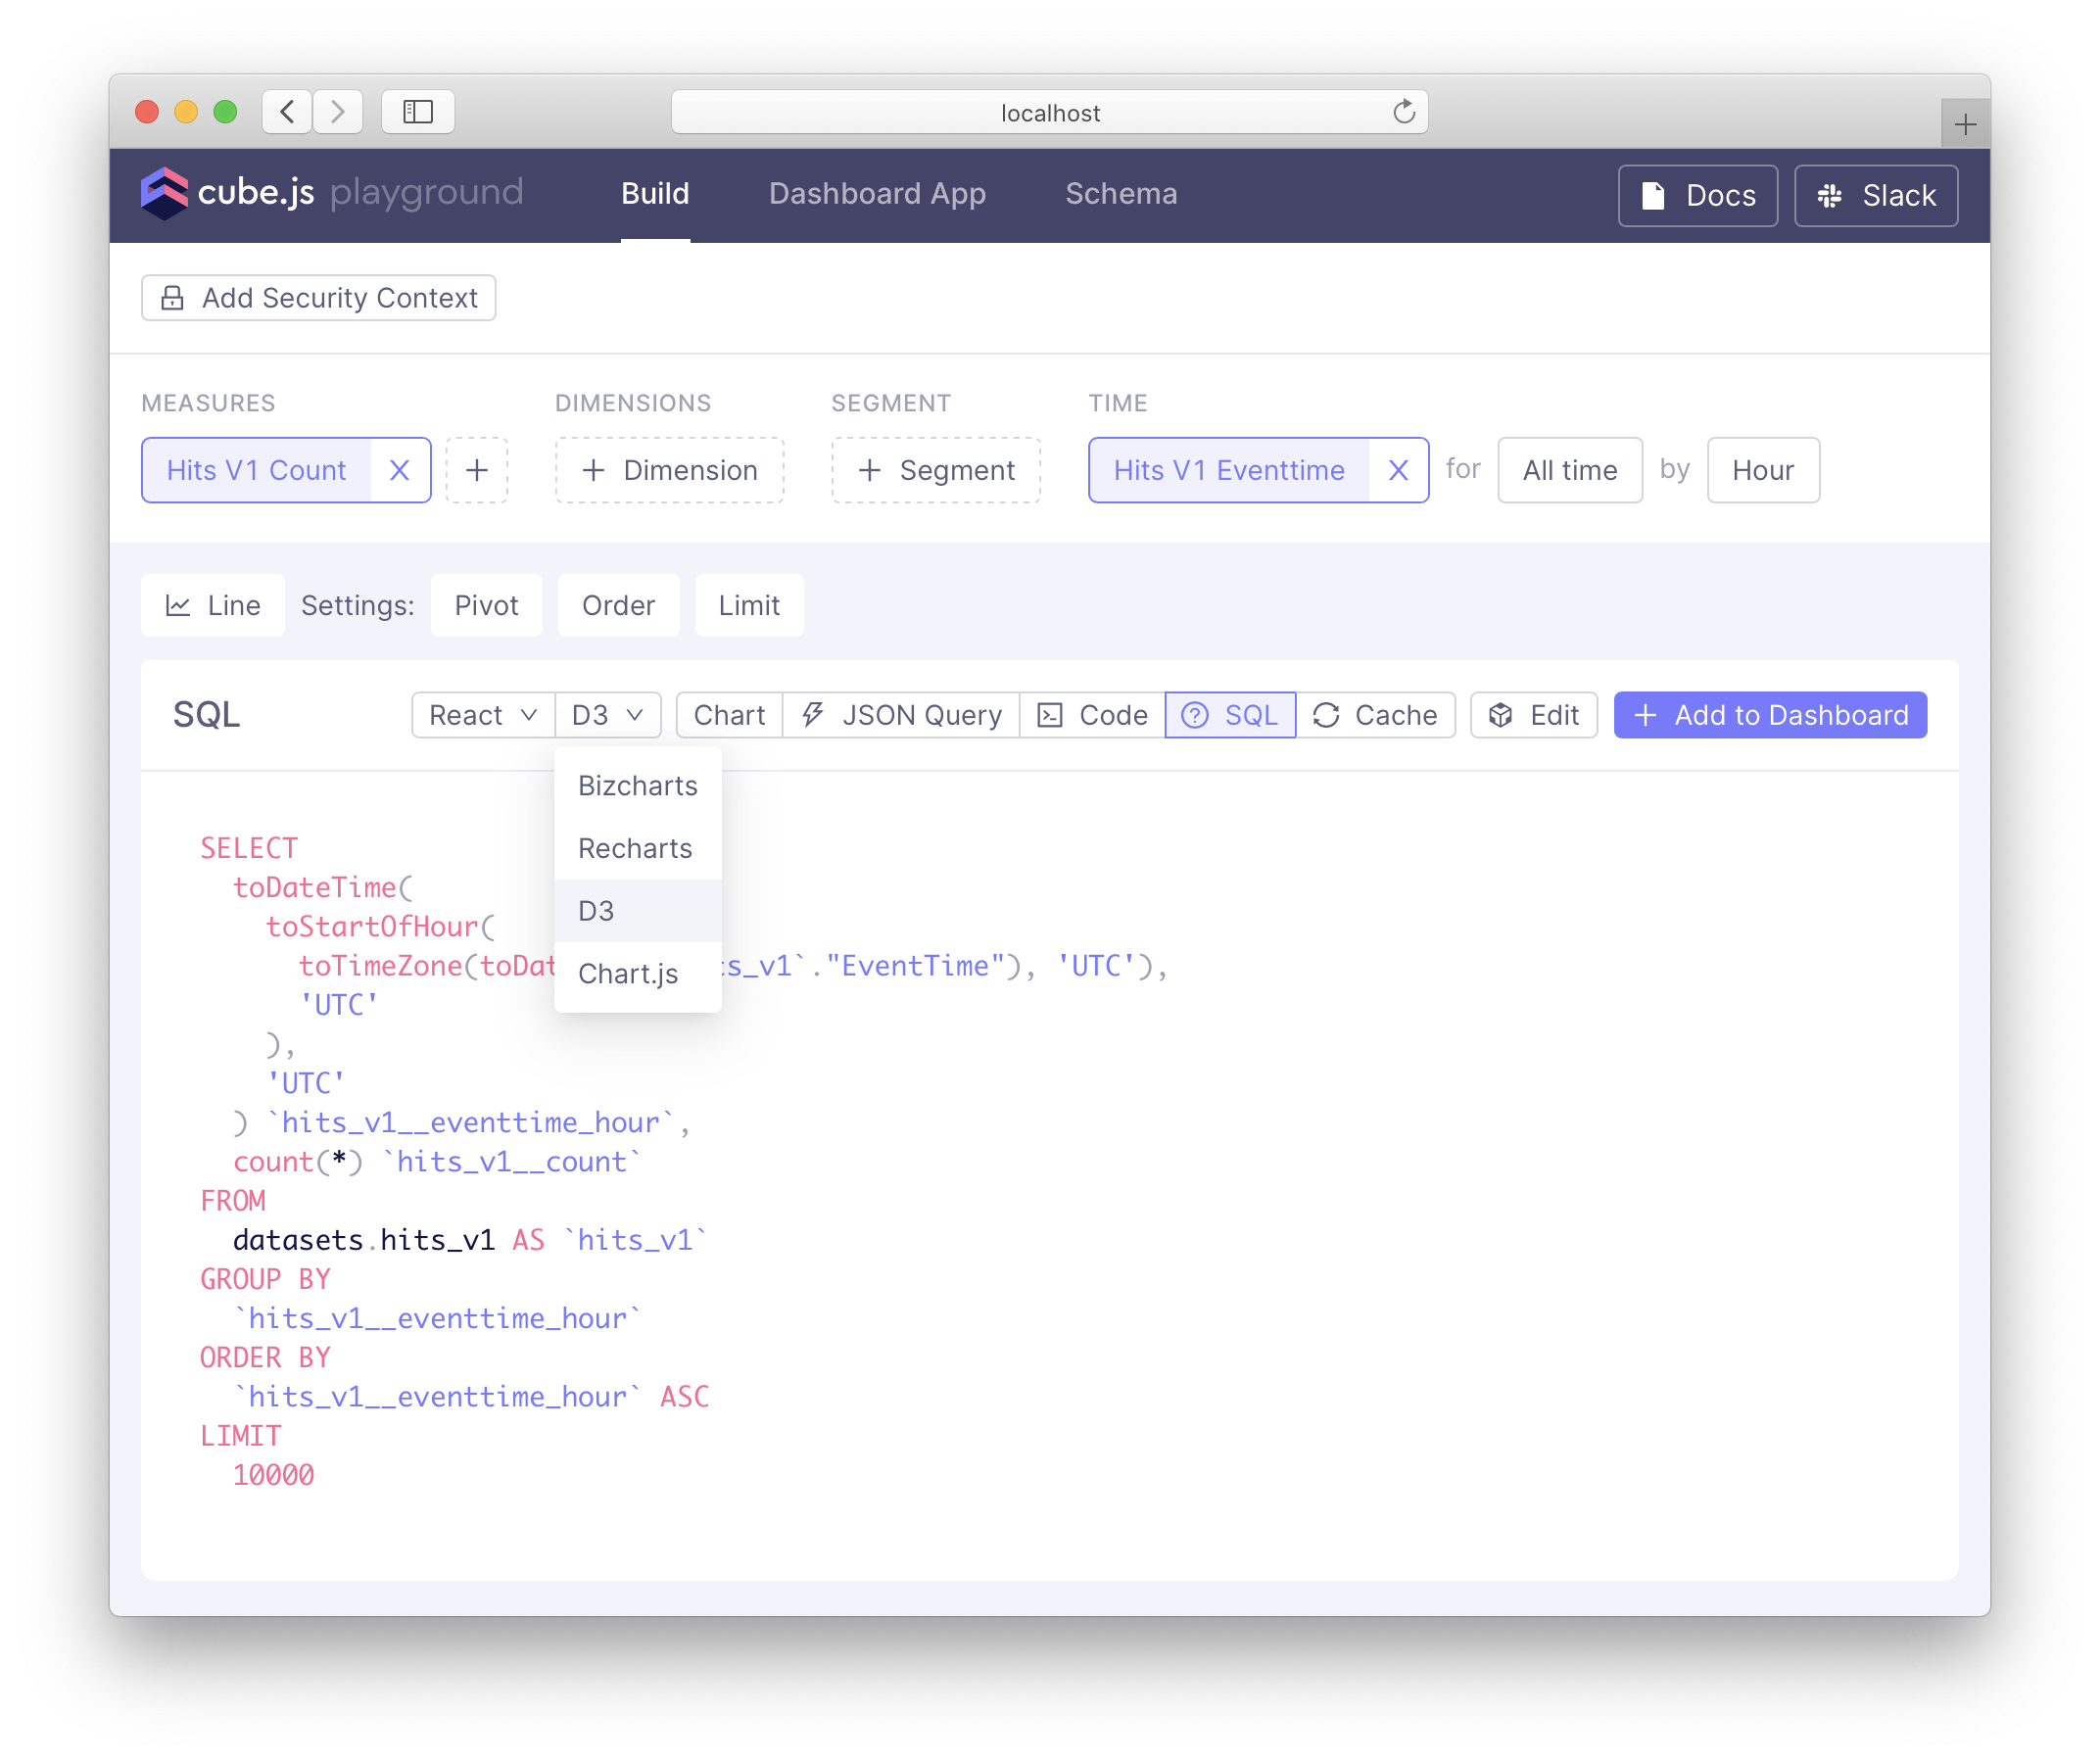
Third, let's check the query. Note there're a lot of controls and options just above the chart. You can switch between different views and charting libraries, view Cube query in JSON format, or browse what SQL was generated for that query. You don't really want to write SQL like that from scratch, right?

It's turbulence, so brace for impact! ✈️
How to Build a Dashboard
Cube Developer Playground has one more feature to explore.
Let's go to the "Dashboard App" tab where you can generate the code for a front-end application with a dashboard (big surprise!). There's a variety of templates for different frameworks (React and Angular included) and charting libraries there but you can always choose to "create your own".

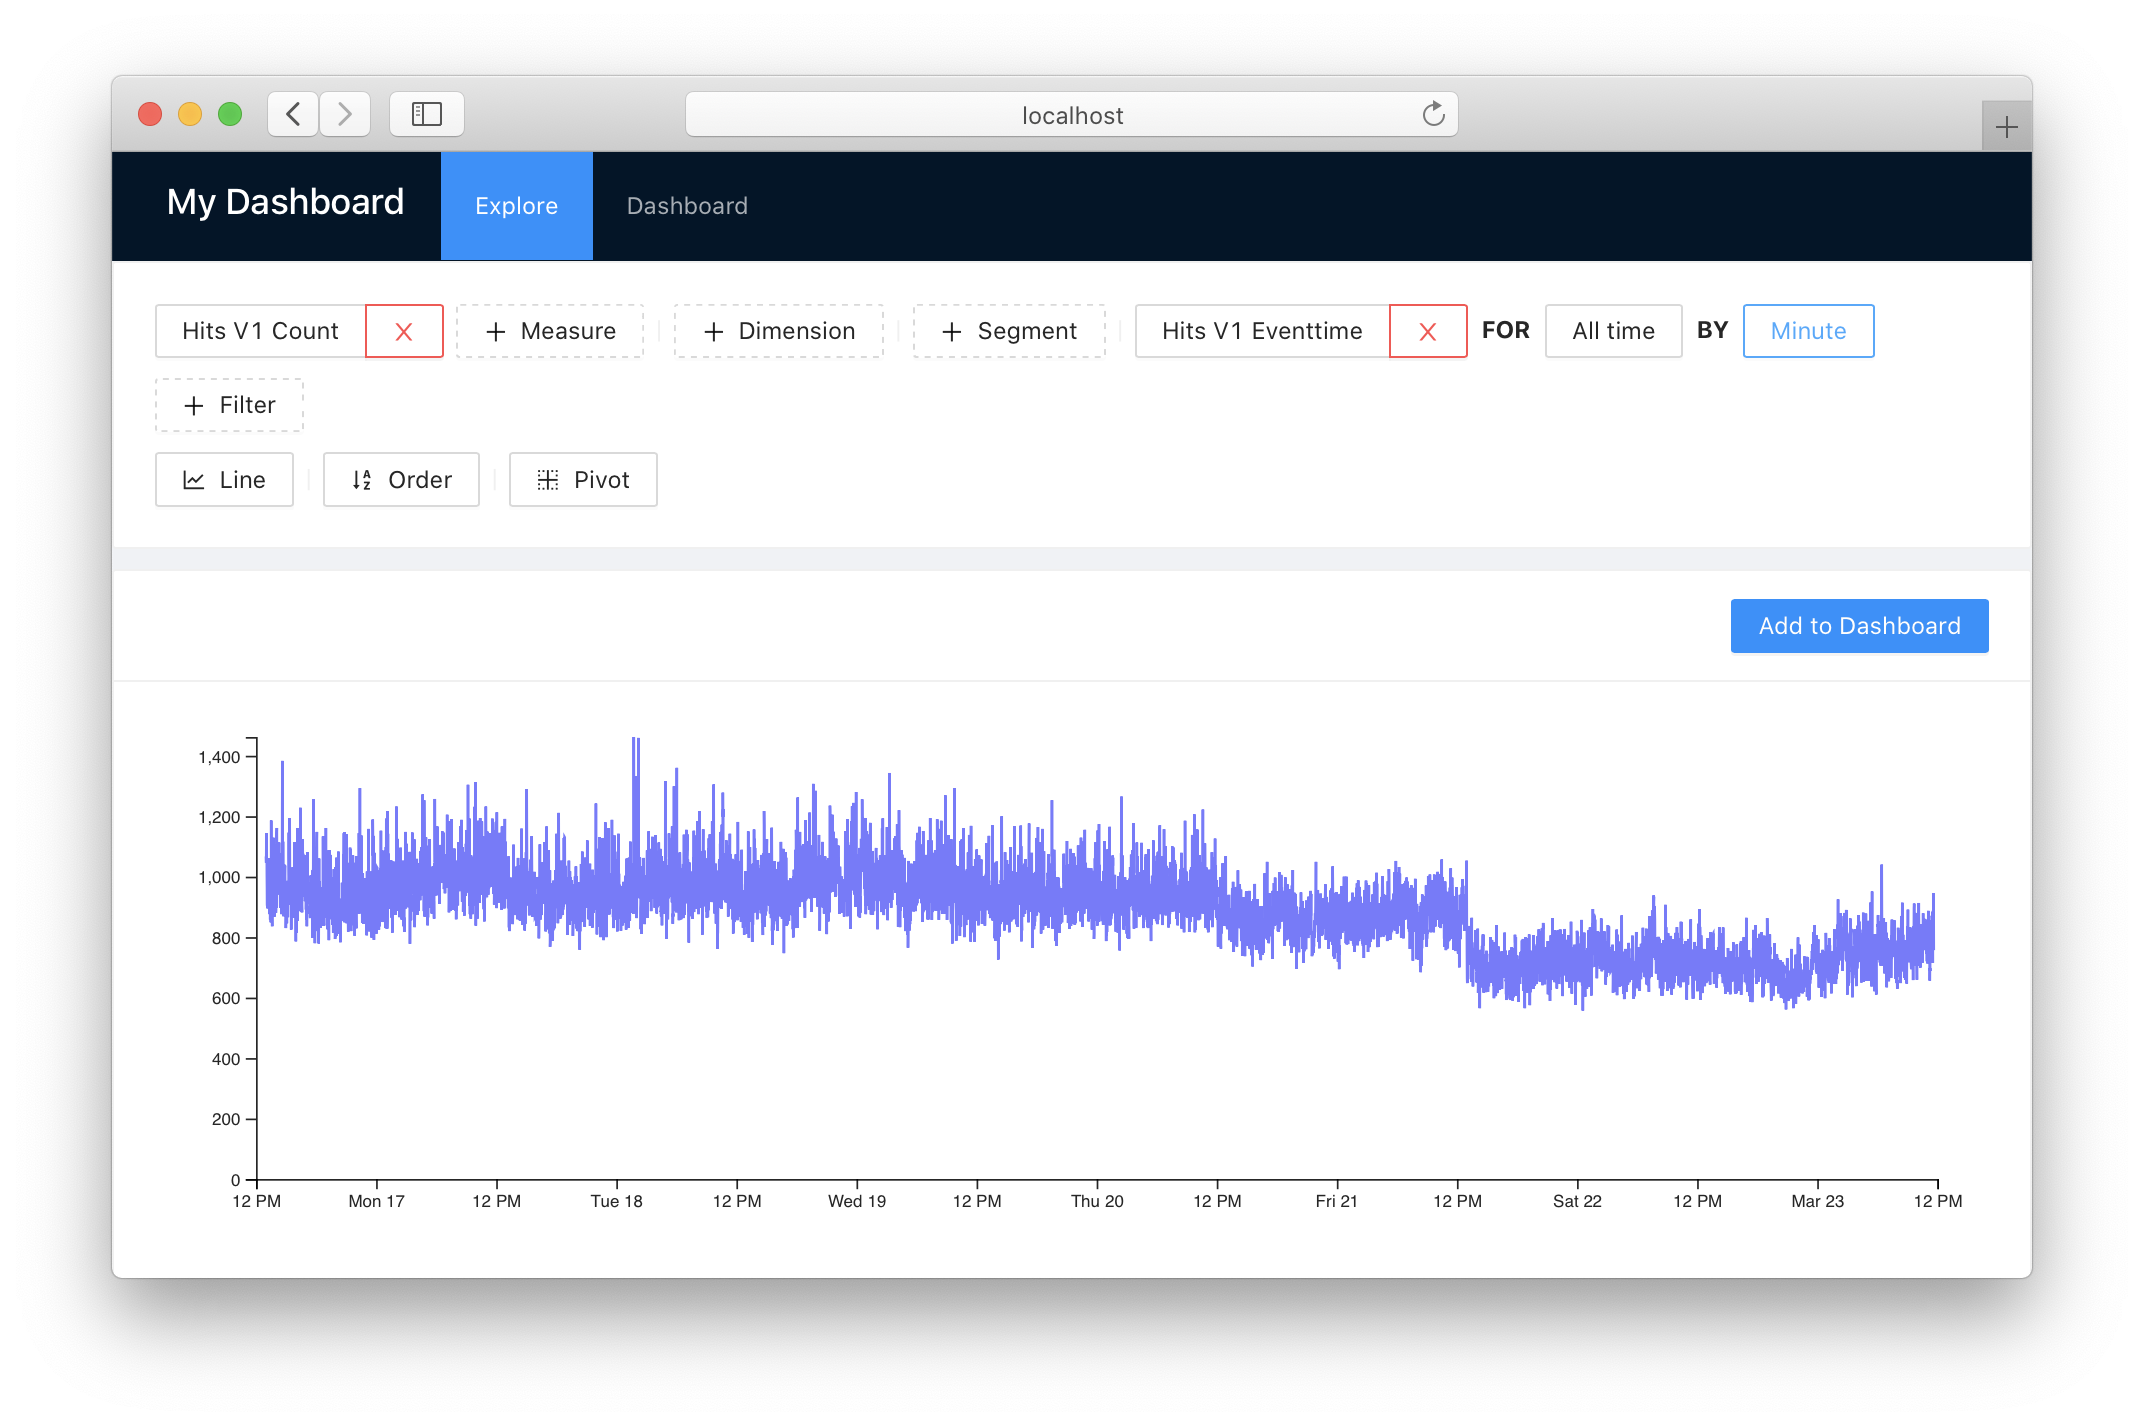
Let's choose "React", "React Antd Dynamic", "D3", and click "OK". Just in a few seconds you'll have a newly created front-end app in the dashboard-app folder. Click "Start dashboard app" to run it, or do the same by navigating to dashboard-app and running:
Believe it or not, this dashboard app will allow you to do what you've already tried. On the "Explore" tab, you can create a query, tailor the chart, and then click "Add to dashboard". On the "Dashboard" tab, you'll see the result.

Impressive? We'll go further than that, so open your window blinds! ✈️
How to Draw the Rest of the Owl
Honestly, it's quite easy to transform this generic dashboard into stock market data visualization in just a few quick steps.
First, let's connect to another datasource. It will still be ClickHouse: behind the scenes and for our convenience, I've set up a dedicated ClickHouse instance in Google Cloud. It holds a fresh version of this stock market dataset which was updated on Feb 17, 2021.

The dataset contains nearly 3 GB and just under 9000 tickers with daily volumes and prices: low, high, open, and close price values. So, it's 28.2 million rows in total which is not much but a fairly decent data volume.

To use this dataset, update your .env file with these contents:
Second, let's compose a data schema. We need to describe our data in terms of measures and dimensions or, in simpler words, in terms of "what we want to know" about the data (i.e., measures) and "how we can decompose" the data (i.e., dimensions). In our case, stock prices have two obvious dimensions: stock ticker (i.e., company identifier) and date.
However, measures are not that straightforward because we'll need to use different aggregation functions (i.e., ways to calculate needed values). For example, daily low prices should be aggregated with the min type because the weekly low price is the lowest price of all days, right? Then, obviously, daily high prices should use the max type. For open and close prices we'll use the avg type, and we'll also employ the count type to calculate the total number of data entries.
Now, make sure that the only file in your schema folder is named Stocks.js and has the following contents:
With these changes you should be all set to restart your Cube instance and use Developer Playground for data exploration. Look how easy it is to find the companies we have the most amount of data about — obviously, because they are publicly traded on the stock exchange since who knows when.

Here we can see Coca-Cola (KO), Hewlett-Packard (HPQ), Johnson & Johnson (JNJ), Caterpillar (CAT), Walt Disney (DIS), etc. Actually, you can easily find out since when they are traded by adding the Stocks.firstTraded measure to your query. Oops! Now you know that we only have the data since the Unix epoch but it's not a big deal, right?
Third, let's build a lightweight but nicely looking front-end app. Developer Playground is great but why not to write some code as we routinely do? It will help us focus and explore the stocks that were popular on the WallStreetBets subreddit.
As stock market gurus, we should obviously use the candlestick chart for data visualization. Though it sounds complicated, a candlestick chart is a powerful way to display pricing data because it allows to combine four values (open, close, low, and high prices) in a single geometric figure. You can dig deeper into Investopedia on the topic.

After that, make sure to go to the dashboard-app folder and install a few npm packages for ApexCharts. We'll use a readily available candlestick chart component so we don't have to build it ourselves. Run in the console:
Then, create a new file at the src/components/GameStock.js location with the following contents. Basically, it uses Cube API to query the dataset, ApexCharts to visualize it, and a few Ant Design components to control what is shown. It's not very lengthy and you can flick though it later:
To make everything work, now go to src/App.js and change a few lines there to add this new GameStock component to the view:
Believe it or not, we're all set! 🎉 Feel free to start your dashboard-app again with npm run start and prepare to be amused.
Not only we can see what happened on Jan 28, 2021 when GameStop (GME) stock price were as volatile as one can't imagine with the low at US $ 112 and high at US $ 483. Definitely have a look at IRM, MAC, or NOK as they were also affected by this movement.

Now we can explore the prices of basically every public company or ETF. Just type in a ticker and choose the desired time frame. Maybe you want to have a look at Google (GOOG and GOOGL) stock prices since 2005? Here they are:

I strongly encourage you to spend some time with this ClickHouse dashboard we've just created. Pay attention to how responsive the API is: all the data is served from the back-end by Cube and queried from ClickHouse in real-time. Works smoothly, right?
Thank you for following this tutorial, learning more about ClickHouse, building an analytical dashboard, exploring the power of Cube, investigating the stock prices, etc. I sincerely hope that you liked it 😇
Please don't hesitate to like and bookmark this post, write a short comment, and give a star to Cube or ClickHouse on GitHub. And I hope that you'll give Cube and ClickHouse a shot in your next fun pet project or your next important production thing. Cheers!


