For a pretty decent amount of time, doing analytics with MongoDB required additional overhead compared to modern SQL RDBMS and Data Warehouses associated with aggregation pipeline and MapReduce practices. While this approach allowed one to craft advanced custom tailored aggregation algorithms it required additional knowledge of how to build and maintain it.
To fill this gap, MongoDB released the MongoDB connector for BI, which acts as a MySQL server on top of your MongoDB data. Under the hood it bridges existing aggregation mechanisms to the MySQL protocol, allowing standard MySQL clients to connect and issue SQL queries.
In this short 30-minutes tutorial we’ll setup the MongoDB connector for your local MongoDB instance and spin up a Node.js application that provides an analytics API, query cache, and orchestration using the Cube.js analytics framework. Cube.js can be used as a standalone server or it can be embedded as part of an existing Node.js web application. You can learn more about it here.
Setting up the MongoDB connector for BI
To install the MongoDB connector for BI locally you can use either quickstart guide or one of the platform dependent installation guides.
Please make sure you use the MongoDB version that supports the MongoDB connector for BI. In this tutorial we use 4.0.5.
If you don’t have a local MongoDB instance please download it here. The BI Connector can be downloaded here.
After the BI connector has been installed please start a mongod instance first. If you use the downloaded installation it can be started from its home directory like so:
The BI connector itself can be started the same way:
Please note that mongosqld resides in another bin directory.
If everything works correctly, you should see a success log message in your shell for the mongosqld process:
If you’re using the MongoDB Atlas you can use this guide to enable BI connector.
Importing test dataset
You can skip this step if you already have data in your DB that can be analyzed. Otherwise you can use the zip code test dataset from MongoDB to populate your DB with some test data.
Download zips.json and run mongoimport from the MongoDB home directory:
Please make sure to restart the MongoDB BI connector instance in order to generate an up-to-date MySQL schema from the just added collection.
Spinning up a Cube.js application
We’ll use Cube.js to make analytic queries to our MongoDB instance. To install its CLI run:
To create a new Cube.js application with MongoBI driver run:
Go to the just created mongo-tutorial directory and edit the just created .env file: replace placeholders with your MongoDB BI connector credentials.
By default it should be something like:
Now generate Cube.js schema files for the zips collection from the test data set or for your own collection:
In order to start a Cube.js dev server you’ll also need a locally running Redis instance, which is used for cache and query queue orchestration. You can download it and run it using these instructions.
If everything went smoothly, you’re able to run the Cube.js dev server:
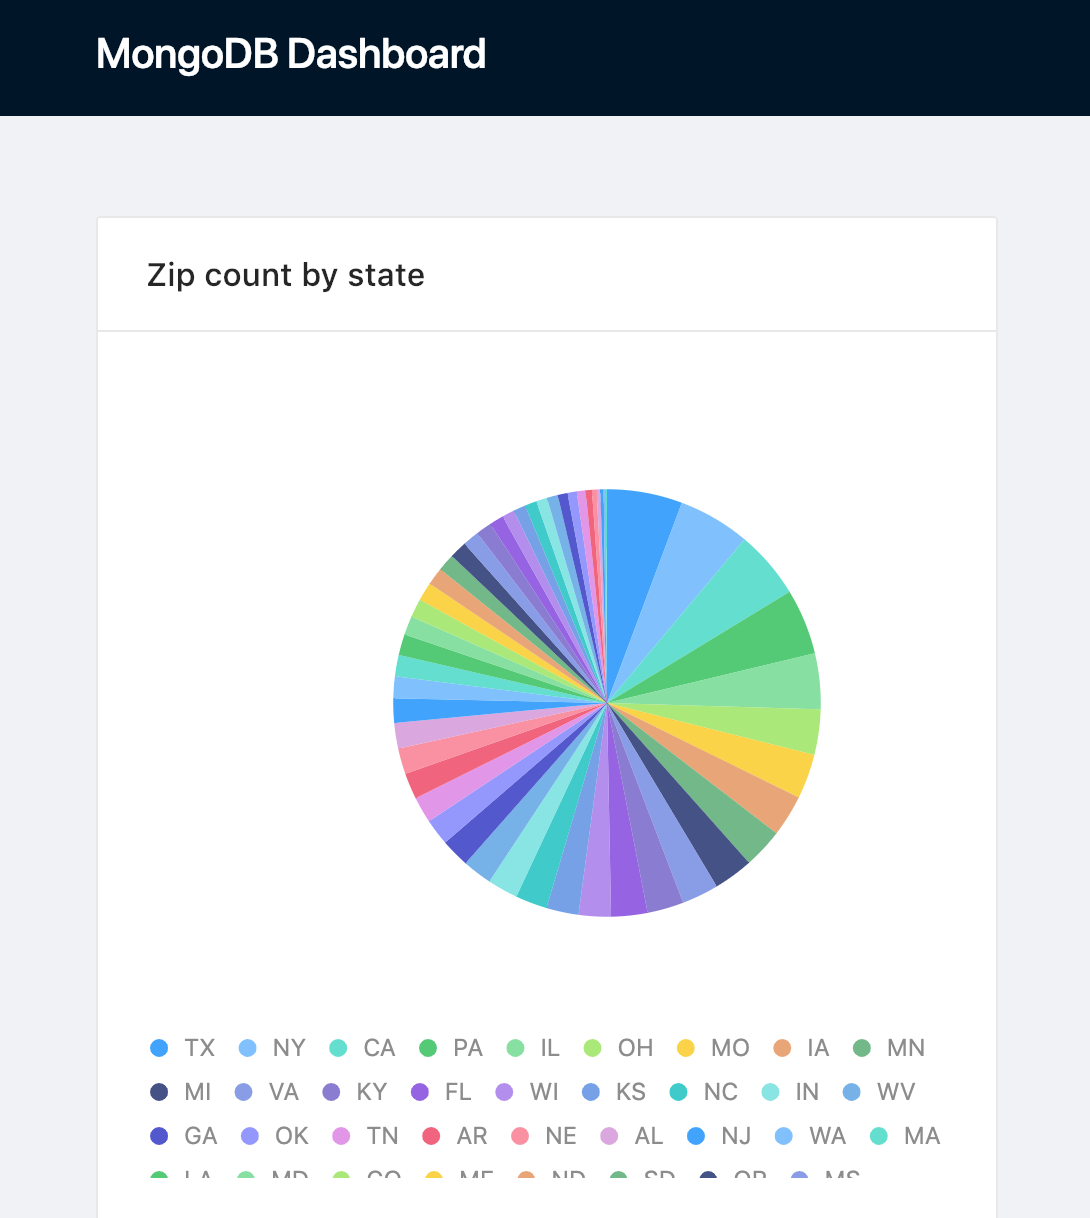
If the server started successfully, you can now open http://localhost:4000 and navigate to the Cube.js dev environment. There you should see a working example of a pie chart.
Building a Dashboard
First, let’s generate our app with Cube.js templates. Navigate to the Dashboard App tab and select “Create your Own” with React and Ant Design.

The Cube.js dev environment example contains all essential client pieces to build an analytics dashboard. Let’s modify it a little bit so it looks more like a dashboard and uses the zips collection.
Replace the contents of index.js in your dev environment code sandbox:
In the development environment, Cube.js doesn't enforce the use of the token to authorize queries, so you can use any string for your token here. You can learn more about using and generating tokens in the production environment here in the docs.
If everything worked well, you should see the following dashboard:
Why Cube.js?
So why is using Cube.js better than hitting SQL queries to MongoDB directly? Cube.js solves a plethora of different problems every production-ready analytic application needs to solve: analytic SQL generation, query results caching and execution orchestration, data pre-aggregation, security, API for query results fetch, and visualization.
These features allow you to build production grade analytics applications that are able to handle thousands of concurrent users and billions of data points. They also allow you to do analytics on a production MongoDB read replica or even MongoDB main node due to their ability to reduce the amount of actual queries issued to a MongoDB instance. Cube.js schemas also allow you to model everything from simple counts to funnels and cohort retention analysis. You can learn more about it here.
Performance considerations
In order to be able to handle a massive amount of data, Cube.js heavily relies on pre-aggregations. As of now, the MongoDB BI Connector doesn’t support Create Table as Statement, which is required to materialize query results right in your database and create pre-aggregations. If you need to analyze well over 100M of data points in MongoDB please consider using Presto with the MongoDB Connector, which is also supported by Cube.js.


